How to Run Exploratory Factor Analysis in R
Run exploratory factor analysis in R with confidence. This guide shows the exact code, checks, outputs, and how to interpret your factors for reports.
Welcome to our R Programming Assignment Help category, your number one resource for mastering data science, statistics, and analytics using the powerful R language. If you are struggling with your R studio homework, facing a research deadline, looking to pay someone to do my r studio homework or just beginning your journey with R programming, we provide expert guidance to help you succeed.
R is one of the most in-demand programming languages for statistical analysis, machine learning, and data visualization. Its open-source nature and robust package ecosystem make it ideal for academic research, business intelligence, and advanced analytics. But despite its capabilities, R has a steep learning curve. This is especially the case when it comes to debugging errors, writing functions, and applying statistical models accurately.
That’s why we created this R-focused category: to simplify the complexity and provide high-quality R programming assignment help to anyone who needs it.
Here, you will find detailed tutorials, solved examples, code walkthroughs, and real-world case studies. Whether it’s linear regression, ANOVA, data wrangling with dplyr, or creating visualizations with ggplot2, we’ve got you covered.
Our other tutorials will include comprehensive guides on how to use R Studio statistics tools effectively, including step-by-step lessons on how to make a histogram in R Studio, as well as how to customize histogram appearance in R Studio for clearer interpretation. We will also cover essential R descriptive statistics, data visualization in R, and how to build R charts and graphs for professional reporting. Learners will gain hands-on experience with R statistical models, including ANOVA in R and how to interpret ANOVA results in R, alongside advanced multivariate analysis R techniques.
For those interested in predictive analytics, we will explore logistic regression in R, multiple regression in R, multiple linear regression in R, ridge regression in R, lasso regression in R, stepwise regression in R, multinomial logistic regression in R, and exactly how to run a regression in R. These tutorials will also compare Python or R for data analysis, provide real-world examples of statistical analysis in R, and support students seeking R assignment help to improve their practical skills and confidence.
Our goal is not only to help you complete your assignments on time but also to understand the core concepts behind each solution. From undergraduate students to PhD researchers, we support clients across all academic levels and project types.
Ready to get personalized help? Visit our R programming services pricing page or reach out through our contact page. Alternatively, email us as admin@myspsshelp.com and we will get back to you soon.
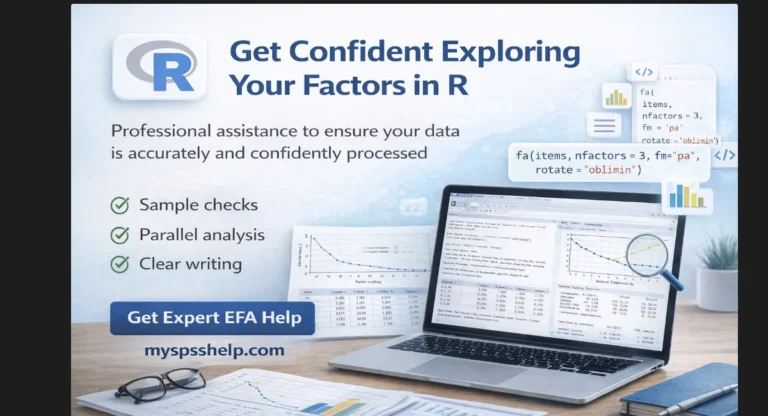
Run exploratory factor analysis in R with confidence. This guide shows the exact code, checks, outputs, and how to interpret your factors for reports.
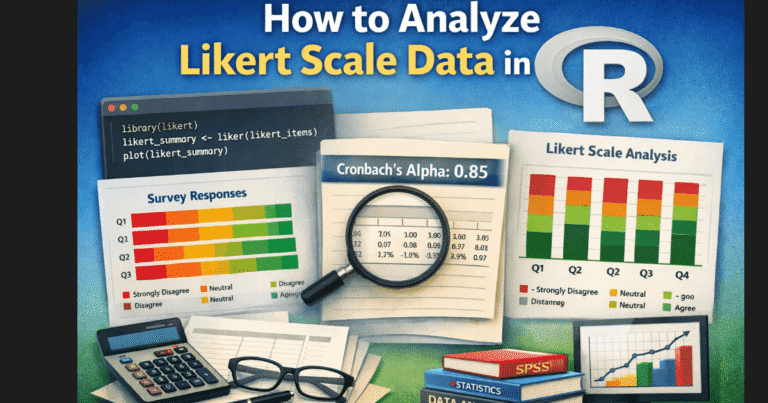
Learn how to analyze Likert scale data in R using statistically appropriate methods. This guide explains ordinal data handling, visualization with the likert and ggplot2 packages, and reliability testing with psych for accurate interpretation.
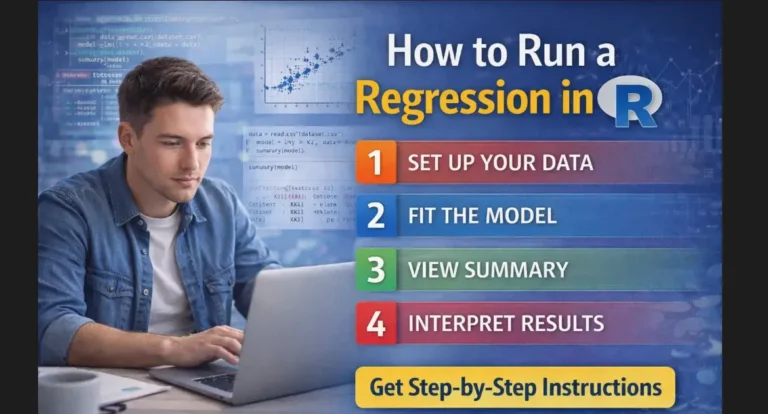
This practical guide shows you how to run a regression in R, interpret results, and choose the right model. Includes clear R code examples for students and beginners.
Discover how ANOVA in R works, learn how to interpret ANOVA results in R, and get professional help if assignments become overwhelming.
This guide explains logistic regression in R using real code examples, interpretation support, and how professional analysts can help you achieve accurate results.
This guide explains how to make a histogram in R Studio using both base R and ggplot2, with clear examples, customization tips, and a friendly learning experience.

How to analyze clinical trial data using structured methods, statistical tools, visualization, and topline reporting. Practical guide with examples and workflows.
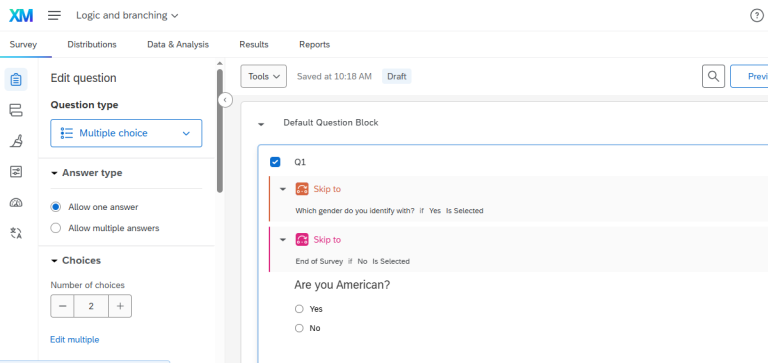
Discover how to take your Qualtrics surveys to the next level with advanced logic and branching. This guide explains everything from basic skip logic to complex embedded data workflows perfect for creating smarter, more personalized surveys.

Designing surveys that produce accurate, high-quality responses begins with asking the right questions. This in-depth guide for PhD-level researchers explains how to formulate effective questions and avoid common design pitfalls.

Struggling with how to analyse questionnaire data after collecting responses? This practical guide shows the exact steps for cleaning, coding, testing, and interpreting survey data, while highlighting where most researchers get stuck. If your analysis feels confusing or your results do not look right, expert support can help you produce accurate, defensible findings faster.

Want to collect reliable survey data? Understanding survey sampling methods is key. This in-depth guide covers everything from probability to non-probability sampling, ensuring your study produces valid, generalizable results.

Struggling to make sense of your survey results? This comprehensive guide walks you through the key steps of survey data analysis, from cleaning data to drawing conclusions that matter.

Need professional help with survey design and analysis? Whether you’re conducting academic research, customer feedback surveys, or product testing, this guide will show you where to find reliable, expert-level support from trusted providers like My Survey Help.

Discover expert survey design services tailored to researchers, startups, PhD students, and businesses. From logic setup to platform configuration. Get it done right.