Analysing questionnaire data correctly determines whether your survey produces real insight or misleading conclusions. Many researchers, students, and project teams collect responses successfully but then struggle at the analysis stage. They face messy datasets, unclear variable coding, wrong statistical choices and confusing outputs from tools like SPSS, R, Jamovi statistics or survey platforms. These mistakes often lead to weak findings and rejected reports.
This complete guide on how to analyse questionnaire data walks you through the full workflow, from data cleaning and coding to selecting the right statistical tests and presenting results clearly. You will learn practical, decision based steps that help you move from raw responses to defensible conclusions. If you feel stuck with questionnaire scoring, cross tabulation, scale construction, or advanced analysis, expert support can save time and protect accuracy. Strong analysis turns survey data into credible evidence, and this guide shows you how to get there with confidence.
Stuck Analysing Questionnaire Data?
Get expert help with coding, statistics, and survey reports so your results stay accurate and publication-ready.
✔ Fast turnaround • ✔ Accurate output review • ✔ Clean outputs • ✔ Research-grade methods
Step 1: Understand Your Research Goals
Before diving into your data, clarify your research objectives. What exactly are you trying to uncover? Are you measuring customer satisfaction, evaluating program outcomes, comparing demographic groups, or testing a theory? Defined goals ensure that your analysis remains focused and actionable.
Each question on your questionnaire should relate directly to one of your objectives. This creates a clear analytic path and prevents unnecessary guesswork. For example, exploratory research seeks to identify patterns and ideas, while confirmatory research tests specific hypotheses.
Step 2: Clean Your Questionnaire Data
Raw questionnaire data often contains errors and inconsistencies that must be corrected. Participants may skip questions, misenter values, or submit multiple entries. Cleaning the dataset ensures that your analysis reflects reliable information.
The process includes removing duplicate or incomplete responses, standardizing text inputs (such as “male” and “Male”), handling missing data through deletion or imputation, and verifying data types (numeric, categorical, date formats). This foundational step prevents flawed insights.
Step 3: Code Open-Ended Responses
Open-ended questionnaire questions provide rich qualitative insights but must be categorized to be useful.
Begin by reading all responses carefully to identify recurring themes. Create a list of categories, assign codes to each, and apply them to the text entries. For example, if several respondents mention “long wait times,” code it under “service delay.”
Quantify these codes to blend qualitative and quantitative data. For advanced analysis, use tools like NVivo or MAXQDA to perform thematic and sentiment analysis.
Short on time? Our team specializes in converting narrative responses into meaningful categories for robust reporting.
Step 4: Choose the Right Statistical Methods
Selecting statistical techniques depends on both your research goals and the type of data collected.
- Nominal data (like gender or occupation): frequency distributions, bar charts, pie charts.
- Ordinal data (such as rating scales): medians, non-parametric tests.
- Interval/ratio data (like age or income): means, standard deviations, t-tests, regressions, and more.
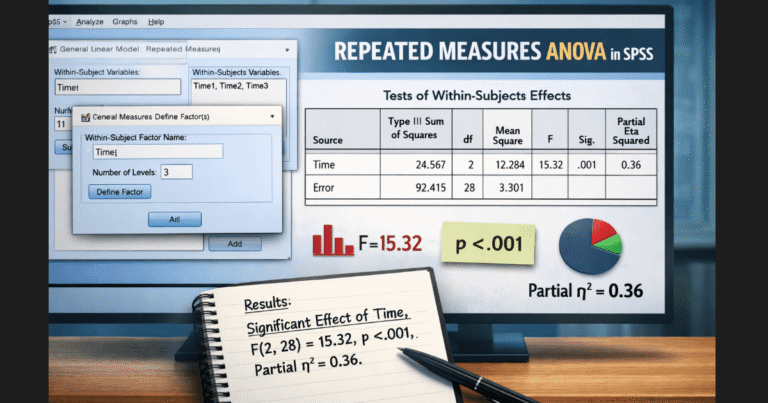
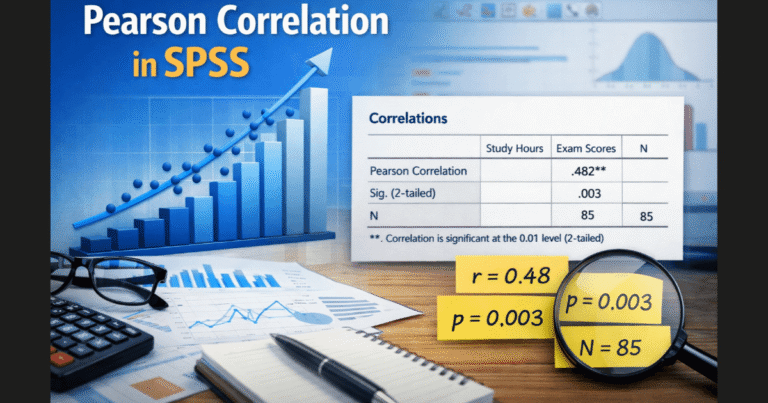
Use descriptive statistics to summarize your data, and inferential statistics to evaluate hypotheses or relationships. Methods like correlation, ANOVA, and cross-tabulation help draw deeper conclusions.
Step 5: Visualize the Data
Data visualization transforms complex datasets into digestible formats. Well-designed visuals help stakeholders quickly grasp trends and make informed decisions.
Use pie charts and bar graphs for categorical variables, histograms for distributions, and scatter plots to explore relationships. Heatmaps and dashboards offer an overview of multi-variable relationships.
Tools like Stata and IBM SPSS can create high-quality visual summaries. Learn more about data visualization using Microsoft Forms and other survey tools.
Step 6: Interpret the Results
After visualizing and running analyses, the next step is to interpret what your data tells you in relation to your research questions.
Examine trends, look for differences between subgroups, and identify whether the results align with your expectations. Avoid assuming causation without evidence. Ensure your conclusions are rooted in statistical validity.
Interpretation requires a critical mindset. Are the patterns meaningful or coincidental? Would another analyst draw the same conclusions? Engage peers or experts if needed.
Step 7: Report the Findings
Presentation is key. An effective report communicates your analysis clearly and professionally.
Include a concise introduction, an explanation of your methodology, a summary of findings, visuals that reinforce your results, and a well-thought-out conclusion with actionable recommendations.
Structure your content logically, avoid jargon, and provide citations where appropriate. For detailed guidance, read our SPSS Dissertation Help.
Step 8: Take Action Based on Insights
Insights mean little without implementation. Use your findings to guide decisions.
If respondents indicate low satisfaction with wait times, re-evaluate service delivery. If a particular demographic is more engaged, focus your outreach efforts accordingly. Effective analysis leads to change.
Decision-making rooted in data fosters continuous improvement across organizations. The final value lies in how insights translate into action.
Turn Raw Survey Responses Into Clear Results
We handle questionnaire data cleaning, scoring, and statistical analysis when your project feels blocked.
✔ Fast turnaround • ✔ Accurate output review • ✔ Student friendly pricing
How to Analyse Qualitative Data from a Questionnaire in SPSS
SPSS is a powerful tool for managing and analysing qualitative responses. After coding your open-ended answers, you can:
- Import coded categories into SPSS.
- Use frequency analysis to see how often certain themes occur.
- Apply cross-tabulations to explore how qualitative themes vary across demographics.
- Run chi-square tests or correlations to test relationships between coded responses and other variables.
SPSS allows you to combine qualitative themes with quantitative data for deeper insights, making it ideal for academic research or large-scale projects.
How to Analyse Qualitative Data from a Questionnaire in Excel
Excel provides a simple but effective way to work with qualitative data, especially for smaller projects. Here’s how:
- Create a table of open-ended responses.
- Assign each response a theme or code in a separate column.
- Use PivotTables to count and summarize coded categories.
- Apply filters and conditional formatting to identify key themes.
- Create charts (bar or pie) to visualize the distribution of themes.
While Excel lacks the advanced statistical power of SPSS, it’s accessible, flexible, and sufficient for most business or student projects.
Mistakes to Avoid
Avoid common pitfalls like ignoring missing values, misapplying statistical methods, overinterpreting weak relationships, and skipping data cleaning.
Be mindful of your assumptions and ensure your tools and methods match your research design.
Other Tools You Can Use to analyse questionnaire data
Several tools support every stage of questionnaire data analysis:
- SPSS for Questionnaire analysis: Powerful for advanced statistical analysis
- R & Python: Ideal for custom scripting and automation
- Excel/Google Sheets: Perfect for entry-level summaries
- Tableau/Power BI: Excellent for building interactive dashboards
- Jamovi: A free, user-friendly statistical software that’s great for beginners and researchers who prefer an intuitive interface over coding
- SQL: Essential for managing and querying large datasets, filtering responses, and preparing data for analysis before importing into tools like SPSS or Excel
Wrong Test or Wrong Coding Can Break Your Findings
Let specialists analyse your questionnaire data and deliver clear tables, tests, and interpretations.
✔ Accurate methods • ✔ Verified outputs • ✔ Revision support • ✔ Accurate output review