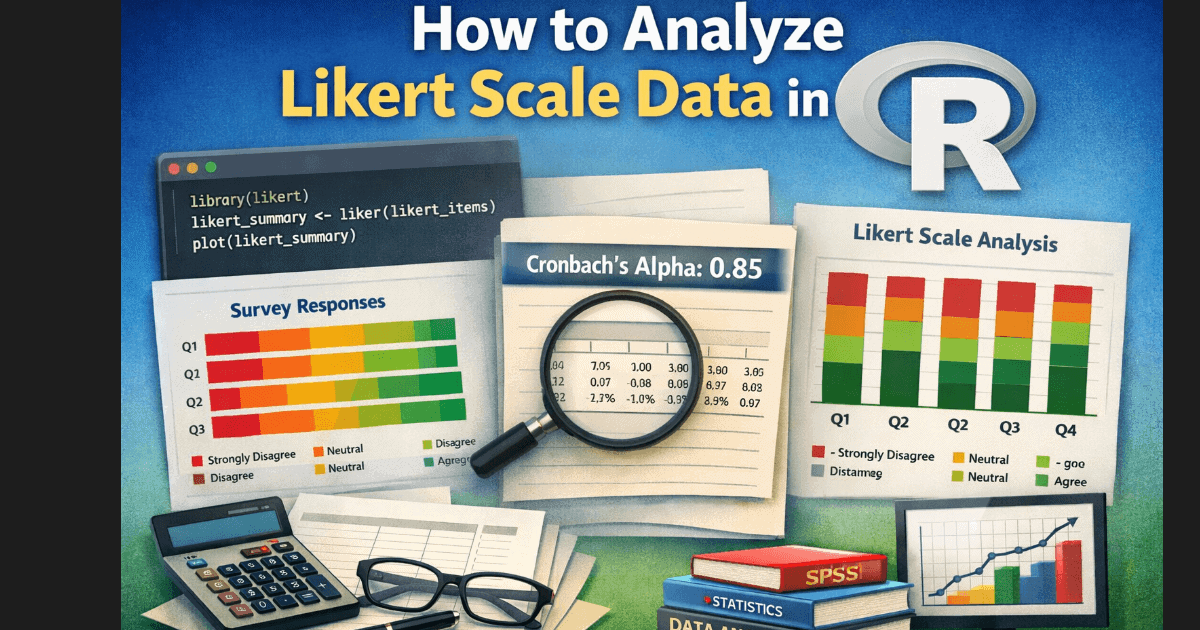
Analyzing Likert scale data in R often appears straightforward until results become inconsistent, outputs fail to align with expectations, or supervisors question the methodology. Many students treat Likert responses as continuous variables, apply inappropriate statistical tests, or skip reliability checks entirely. These issues rarely appear obvious during coding but become critical during interpretation or review.
This guide explains how to analyze Likert scale data in R using statistically valid methods. You will learn how to structure your dataset, apply appropriate R packages, visualize results, and test internal consistency. More importantly, you will understand where most analyses go wrong and how to avoid errors that can invalidate your findings.
Importing and Preparing Likert Scale Data in R
Before analysis, Likert data must be structured correctly. Likert-scale responses represent ordered categories, not continuous values. Treating them incorrectly leads to flawed results.
Begin by importing your dataset:
data <- read.csv("likert_data.csv", stringsAsFactors = TRUE)Define Likert items as ordered factors:
data$Q1 <- factor(
  data$Q1,
  levels = c("Strongly Disagree", "Disagree", "Neutral", "Agree", "Strongly Agree"),
  ordered = TRUE
)
Clean missing values:
library(dplyr)
data <- data %>% drop_na()
Inspect distributions:
table(data$Q1)
This step ensures that categories are properly coded. If factor levels are unordered or inconsistent, every subsequent analysis becomes unreliable.
Why Most Likert Scale Analysis in R Goes Wrong
Most errors in Likert scale analysis do not come from code syntax. They come from incorrect assumptions.
Common issues include:
- Treating ordinal data as continuous
- Calculating means without justification
- Ignoring response distribution
- Misinterpreting scale direction
Another major issue is incorrect factor ordering. If categories are not explicitly ordered, R processes them incorrectly, producing misleading outputs without warning.
These mistakes often remain hidden until interpretation. In academic work, this can result in rejected findings or forced revisions.
Struggling With Likert Scale Analysis in R?
If your data is incorrectly coded, your entire analysis can become invalid without you realizing it. Many students only discover errors after submission or during supervisor review. Get your Likert scale analysis structured correctly from the start and avoid costly mistakes.
Summarizing Likert Data with the likert Package
The likert package is designed specifically for Likert-scale data.
Install and load:
install.packages("likert")
library(likert)
Select items:
likert_items <- data[, c("Q1", "Q2", "Q3", "Q4")]
likert_summary <- likert(likert_items)
summary(likert_summary)
Generate visualization:
plot(likert_summary)
Grouped visualization:
plot(likert_summary, group.order = c("UX", "Support", "Pricing"))This produces clear distribution-based insights rather than misleading averages.
However, visualization alone is not sufficient. Without validating the structure of your data, interpretation can still be flawed.
For broader context on how survey data is handled end-to-end, the workflow aligns with approaches used in survey data analysis.
When the likert Package Alone Is Not Enough
The likert package simplifies summarization but does not validate your analysis.
Common limitations:
- No reliability testing
- No validation of scale structure
- No support for deeper statistical modeling
Many students rely on plots without verifying whether items belong together conceptually or statistically.
At this point, the challenge is no longer coding. It becomes a methodological issue. Incorrect grouping or interpretation weakens the entire analysis.
Visualizing Likert Scale Data Using ggplot2
For more control over visuals:
library(tidyr)
long_data <- pivot_longer(
  data,
  cols = starts_with("Q"),
  names_to = "Question",
  values_to = "Response"
)
Plot:
library(ggplot2)
ggplot(long_data, aes(x = Response, fill = Response)) +
  geom_bar(position = "fill") +
  facet_wrap(~Question) +
  coord_flip() +
  scale_y_continuous(labels = scales::percent_format()) +
  labs(
    title = "Distribution of Likert Responses",
    y = "Percentage",
    x = "Response Level"
  )
These plots highlight patterns clearly and are suitable for reporting.
Analyzing Internal Consistency with psych
Reliability testing ensures that items measure the same construct.
install.packages("psych")
library(psych)
Run Cronbach’s alpha:
alpha(data[, c("Q1", "Q2", "Q3", "Q4")])Additional checks:
describe(data)
fa.parallel(data)
Values above 0.7 indicate acceptable reliability.
A low alpha often signals deeper issues such as poor item design or inconsistent constructs. Randomly removing items without theoretical justification weakens your analysis.
Interpreting and Reporting Likert Scale Results
Focus on:
- distributions
- percentages
- medians
Avoid relying solely on means.
Example:
“65% of respondents agreed or strongly agreed.”
Export visuals:
ggsave("likert_results.png", width = 8, height = 5)Clear reporting strengthens credibility and ensures your analysis is defensible.
Common Mistakes When Analyzing Likert Data
- Using means for ordinal data
- Ignoring factor ordering
- Skipping reliability testing
- Applying incorrect statistical tests
- Over-interpreting small differences
Why These Mistakes Can Cost You Your Results
These mistakes directly affect validity.
Consequences include:
- rejected methodology
- inconsistent findings
- incorrect conclusions
Most issues arise not from tools, but from incorrect analytical decisions.
When Likert Data Can Be Used for Correlation or Regression
Use aggregated scores only after:
- confirming reliability
- validating constructs
Otherwise, apply nonparametric methods such as Spearman correlation.
Not Sure If Your Likert Analysis Is Statistically Correct?
Running code is one thing, but ensuring your results are valid, reliable, and academically acceptable is another. From Cronbach’s alpha to proper interpretation, small mistakes can weaken your entire study. Get structured support to ensure your results are accurate and defensible.
Should You Analyze Likert Scale Data in R Yourself?
If your dataset is simple and you understand ordinal data, you can proceed independently.
However, complexity increases when:
- multiple constructs exist
- dissertation standards apply
- advanced interpretation is required
At this level, errors are less about code and more about methodology. Ensuring accuracy becomes critical, especially for academic submissions.
For structured projects involving full workflows, validation, and interpretation, the approach aligns with what is typically handled in statistical analysis in R.
Conclusion
Analyzing Likert scale data in R requires careful handling of ordinal data, appropriate statistical methods, and correct interpretation. When each step is executed properly, results become reliable and defensible.
Most problems arise from incorrect assumptions rather than technical limitations. Small mistakes in coding or interpretation can affect the entire outcome of your research.
For more complex datasets, multiple constructs, or academic-level analysis, ensuring methodological accuracy becomes essential. In such cases, structured support through services like R Studio homework and analysis help can help refine your results and ensure they meet required standards.
FAQs: Likert Scale Data Analysis in R
1. Can I analyze Likert scale data in R without statistics knowledge?
You can run code, but correct interpretation requires understanding ordinal data.
2. Why is Likert data considered ordinal?
Because responses represent ordered categories, not equal intervals.
3. Can I calculate mean for Likert data?
Only under specific conditions after scale validation.
4. What is the best package for Likert analysis in R?
The likert package for visualization, combined with psych for reliability.
5. Why is Cronbach’s alpha important?
It measures internal consistency across items.
6. What is a good Cronbach alpha value?
Values above 0.7 are generally acceptable.
7. Can Likert data be used in regression analysis?
Yes, after aggregation and validation.
8. What happens if I treat Likert data as continuous incorrectly?
Results become statistically invalid.
9. How do I visualize Likert data in R?
Use likert package or ggplot2 for proportional charts.
10. Can I automate Likert analysis in R?
Yes, using scripts and packages for reproducible workflows.
11. How do I know my Likert analysis is correct?
You must validate data structure, reliability, and interpretation methods.
12. Can someone help me analyze Likert scale data in R?
Yes, especially for complex or academic-level projects requiring accurate methodology.