Qualtrics has become one of the most advanced platforms for digital research, insight generation, and experience management. From academic institutions such as Purdue, Duke, Harvard, Cornell, Rutgers, OSU, UF, WVU, and UNC to global enterprises and healthcare organizations, the platform continues to set the standard for high-precision data collection and analysis.
This Qualtrics guide offers a detailed look at what the platform provides, how to use it effectively and why many organizations rely on it for mission-critical research. At Myspsshelp.com, we assist users worldwide in creating rigorously designed Qualtrics surveys that support decisive action.
What is Qualtrics?
Qualtrics is an enterprise-level experience management (XM) system equipped with advanced tools for survey creation, automated workflows, real-time dashboards, and AI-powered analytics. Whether you are conducting longitudinal studies, academic experiments, CX/EX programs, or public-sector research, Qualtrics delivers a complete suite of capabilities that support complex and large-scale initiatives. Its popularity across institutions such as Purdue Qualtrics, Duke Qualtrics, Harvard Qualtrics, UF Qualtrics, Rutgers Qualtrics, Cornell Qualtrics, and OSU Qualtrics demonstrates its strength in academic and enterprise environments.
How to Use Qualtrics: Quick Start Walkthrough
To begin, create an account or initiate the Qualtrics login through your organization if your institution provides licensed access. Many universities offer dedicated portals such as Purdue Qualtrics or UNC Qualtrics, enabling students and faculty to access the platform at no additional cost.
Once logged in, the dashboard becomes your central operational environment. A new survey can be built from templates or from scratch, using a drag-and-drop editor that supports sophisticated logic tools. Users can apply display logic, skip logic, branching rules, embedded data paths, and randomization constructs to tailor the experience. After developing your instrument, distribute it using email invitations, SMS, QR codes, anonymous links, social channels, or website intercepts. As responses accumulate, the analytics module allows you to monitor trends, review raw data, and export your dataset to SPSS, Excel, CSV, or Power BI.
Step-by-Step: How to Create a Survey in Qualtrics
Step 1: Create a Qualtrics Account
Register through Qualtrics.com or through your institution’s licensed portal. Many universities provide direct access, such as Cornell Qualtrics, Qualtrics Purdue, or Harvard Qualtrics.
Step 2: Start a New Project
Select “Create Project” and choose between a blank survey or a template. Templates help accelerate deployment of standardized instruments.
Step 3: Build Your Survey
Use the editor to add questions, logic, blocks, and embedded variables. Reusable blocks streamline complex research workflows.
Step 4: Configure Survey Flow
Navigate to Survey Flow to manage branching, randomizers, embedded data, and the overall structural design.
Step 5: Preview and Deploy
Review the full instrument before sending. Distribute via email, SMS, web link, or QR code with options for anonymous or authenticated participation.
Step 6: Analyze and Export Data
Use dashboards, cross-tabs, and text analytics to interpret patterns. Export datasets to formats such as Excel, SPSS, or CSV for deeper statistical work.
Key Features Highlighted in This Qualtrics Guide
1. Advanced Logic and Personalization
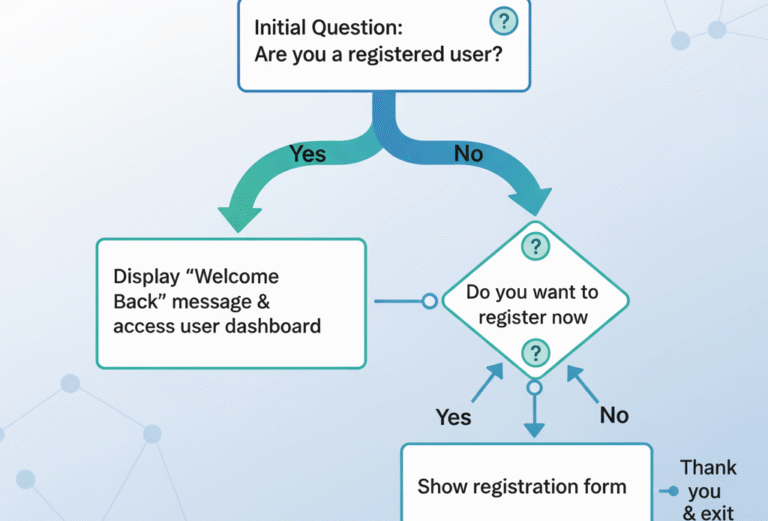
Qualtrics supports complex survey logic that ensures each respondent encounters the most relevant pathway. This includes display logic, skip patterns, branching, piped text, and embedded metadata that create fully customized experiences.
2. Extensive Question Library
Users can draw from over 25 specialized question types. Examples include rank order, heat maps, side-by-side matrices, drill-down menus, timing questions, slider scales, and constant sum allocations. These items allow researchers to tailor surveys for behavioral, academic, or commercial needs.
3. Dynamic Dashboard Reporting
Qualtrics offers robust reporting infrastructure with customizable dashboards, cross-tabulation features, pivot tables, filters, and AI-assisted text analytics. These tools allow for rapid interpretation of findings and seamless presentation to organizational stakeholders.
4. Multilingual Deployment
With built-in translation workflows, researchers can launch identical surveys across multiple languages. Language versions remain centrally managed, allowing easy editing and localization across global regions.
5. Integrations and Data Connectivity
Qualtrics integrates with numerous enterprise systems, including Salesforce, Tableau, Slack, Microsoft Teams, Adobe Experience Cloud, and Google Analytics. These integrations strengthen operational insight pipelines and support unified data management strategies.
6. Security and Compliance
The platform complies with major standards such as GDPR, HIPAA, FedRAMP, and ISO 27001, enabling research in highly regulated fields, including healthcare and government.
Benefits of Using Qualtrics
Research-Grade Capability
The environment is engineered for academic, scientific, and enterprise-level studies. Precision control over design and distribution ensures reliable data quality.
Multi-Channel Distribution
Qualtrics supports email distribution, SMS delivery, social media recruitment, mobile data collection, kiosks, and anonymous or tracked response management.
Enterprise Scalability
For organizations with multiple teams, Qualtrics supports role-based permissions, audit trails, shared libraries, and centralized governance.
Embedded Analytics
Built-in AI tools elevate analysis by automating theme extraction, sentiment scoring, and predictive modeling.
Longitudinal Study Support
Qualtrics is well suited for recurring measurement, cohort tracking, and panel management—capabilities often used by large universities and enterprise research teams.
Limitations of Qualtrics
Pricing Structure
As a premium platform, Qualtrics requires investment. Individuals and small businesses may find costs restrictive unless they have institutional access such as Purdue Qualtrics, WVU Qualtrics, or Rutgers Qualtrics.
Learning Curve
Although intuitive for researchers with experience in platforms like Qualtrics XM or Qualtrics Survey tools, beginners may need guidance to navigate its extensive features.
License-Restricted Features
Certain analytics functions, dashboards, and automation modules are available only through higher-tier or enterprise plans.
Who Should Use Qualtrics?
Qualtrics is a strategic choice for:
- PhD candidates conducting dissertation research
- University departments performing large-scale academic studies
- Corporations evaluating customer and employee experience
- Healthcare systems measuring patient satisfaction
- Government entities engaged in public policy research
How does Qualtrics Compare To Other Survey Tools?
| Feature | Qualtrics | SurveyMonkey | Microsoft Forms | Typeform |
|---|---|---|---|---|
| Ease of Use | Medium | High | High | High |
| Templates | 100+ | 200+ | Limited | 50+ |
| Logic & Flow | Very Advanced | Advanced | Basic | Basic |
| Analytics | Excellent | Good | Basic | Moderate |
| Price | Premium | Freemium | Free | Freemium |
| Integrations | Enterprise | Mid-range | Limited | Good |
Final Thoughts
This Qualtrics guide highlights why the platform remains a global leader for academic institutions, enterprises, and public-sector organizations seeking advanced digital research capabilities. If your work requires accuracy, security, integration flexibility, and analytical depth, Qualtrics is a powerful solution. At Myspsshelp.com, we provide complete support for Qualtrics survey setup, logic design, deployment, and questionnaire data analysis. Our team works with clients worldwide to ensure high-quality data collection that supports confident decision-making.