A cross sectional study is often where many dissertation projects start, and where many students get stuck.
The issue is rarely the definition. Most students understand that it involves collecting data at one point in time. The real problem begins after data collection. Questions arise around sampling, questionnaire design, and more importantly, how to analyze the data correctly and explain the results in a way that satisfies supervisors.
This guide moves beyond definitions. It explains how a cross sectional study actually works in practice, how to structure it properly, and how to analyze your data without making the mistakes that commonly lead to rejected drafts or major revisions.
What Is a Cross Sectional Study?
A cross sectional study is an observational research design used to examine variables within a population at a single point in time. Researchers collect data once and analyze relationships, prevalence, or patterns across variables.
In practical terms, this means:
- No follow-up period
- No repeated measurements
- All variables measured simultaneously
For example, a student may collect survey data on stress levels and academic performance within the same week. The goal is to identify patterns or associations, not to prove causation.
This distinction matters. Many students lose marks by interpreting relationships as cause-and-effect. A cross sectional study can show that two variables are related, but it cannot prove that one causes the other.
Why Students Struggle With Cross Sectional Studies
The difficulty is not the design itself. It is the execution.
Most problems fall into three areas:
1. Poor questionnaire design
Students collect data that does not align with their research questions. This often leads to weak or unusable results. Structuring a questionnaire correctly from the start is critical, especially when working with survey tools or structured instruments. A more detailed breakdown of this process can be seen in this survey design guide, where variable alignment is handled at a practical level.
2. Wrong statistical test selection
Choosing the wrong test is one of the fastest ways to lose marks. Many students attempt regression when a simple correlation or chi-square test would be more appropriate.
3. Inability to interpret results
Even when the analysis is correct, interpretation becomes a challenge. Supervisors expect clear explanations, not just SPSS output.
This is why many students eventually look for structured guidance on survey data analysis, especially when working under deadlines.
Cross Sectional Study Example (What Actually Works)
Consider a dissertation examining the relationship between social media usage and academic performance.
- Data is collected once using a questionnaire
- Variables include hours spent on social media and GPA
- The dataset is analyzed using correlation and regression
The results may show a relationship between increased usage and lower GPA. However, the study cannot claim that social media causes poor performance. It only identifies an association.
A second example appears in public health. A researcher may assess smoking behavior and respiratory symptoms within a population during a single survey period. The study estimates prevalence and explores associations using statistical testing.
The structure is always the same:
- One-time data collection
- Multiple variables measured simultaneously
- Statistical analysis to identify relationships
How to Analyze Cross Sectional Study Data
This is where most dissertations break down.
After data collection, analysis must align with:
- Your research questions
- Your variable types
- Your hypotheses
Step 1: Descriptive Analysis
Start by summarizing your data:
- Frequencies
- Means
- Standard deviations
This step provides a clear overview of your sample.
A structured approach to this stage is outlined in this descriptive analysis SPSS guide, which shows how to prepare data before deeper testing.
Step 2: Choose the Right Test
The correct test depends on your variables:
- Categorical vs categorical → chi-square
- Continuous vs continuous → correlation
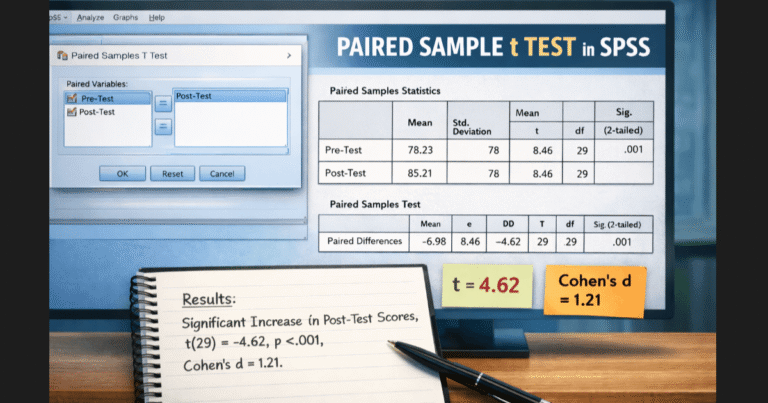
- Group differences → t-test or ANOVA
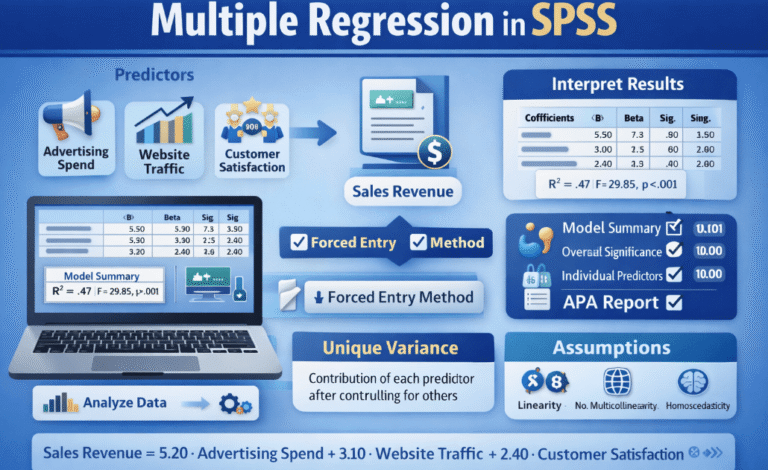
- Prediction → regression
For example, if you are testing relationships between categorical variables, understanding how to run and interpret a chi-square test in SPSS becomes essential.
If your study involves relationships between continuous variables, a bivariate correlation approach is often more appropriate than jumping straight into regression.
Step 3: Regression Analysis (When Needed)
Regression is often overused.
It should only be applied when:
- You are predicting an outcome variable
- You have a clear model structure
A proper walkthrough of this process is covered in this linear regression SPSS guide, which explains when regression is justified and how to interpret outputs correctly.
Step 4: Interpretation (Where Most Lose Marks)
Supervisors are not looking for SPSS output tables. They are looking for interpretation.
You must:
- Explain what the results mean
- Link findings to your research questions
- Avoid causal language
Many students struggle at this stage, which is why structured support in dissertation data analysis often becomes necessary when deadlines approach.
Sampling Methods in Cross Sectional Studies
Sampling directly affects the quality of your findings.
Common approaches include:
- Convenience sampling: easiest but weakest
- Random sampling: stronger but harder to implement
- Stratified sampling: improves representation
Many dissertations rely on convenience sampling due to time constraints. However, this introduces bias, which must be acknowledged in your methodology.
Understanding sample size is equally important. Using structured formulas such as the one explained in this Cochran sample size guide helps ensure your study remains statistically valid.
Cross Sectional Study vs Longitudinal and Cohort Designs
A cross sectional study captures a snapshot.
- Cross sectional → one time point
- Cohort → follows participants over time
- Longitudinal → repeated measurements
Students often confuse these designs when writing methodology sections.
The key difference:
- Cross sectional studies identify relationships
- Longitudinal and cohort studies assess change and causality
Choosing the wrong design or describing it incorrectly weakens your entire dissertation.
Common Mistakes That Cost Students Marks
These mistakes appear repeatedly:
Misinterpreting correlation as causation
This is the most serious issue and often flagged by supervisors.
Using the wrong statistical test
Applying regression when a simpler test is required leads to incorrect conclusions.
Poor questionnaire structure
If variables are not measured correctly, analysis becomes meaningless.
Ignoring data cleaning
Unclean datasets produce unreliable results. Handling missing values and coding errors is a necessary step, often overlooked. A structured process for this is outlined in this data cleaning in SPSS guide.
Weak results write-up
Even correct analysis fails if it is not presented properly. Many students struggle with structuring Chapter 4, which is why guides like this SPSS dissertation write-up guide become critical.
How to Get Your Cross Sectional Study Right the First Time
To avoid delays and revisions:
- Align your questionnaire with your research objectives
- Choose statistical tests based on variable types
- Clean and prepare your dataset before analysis
- Focus on interpretation, not just output
Students who follow this structure produce stronger, clearer, and more defensible research.
Those who do not often find themselves revising entire chapters or seeking last-minute help to fix analysis issues.
Conclusion
A cross sectional study is one of the most practical research designs, but it requires careful execution to produce meaningful results.
Understanding the definition is only the starting point. The real work lies in:
- Designing the study correctly
- Selecting appropriate statistical methods
- Interpreting results accurately
When these elements align, the study becomes clear, defensible, and academically strong.
When they do not, even a well-collected dataset can fail to deliver useful findings.
For students working under pressure, getting the analysis and interpretation right the first time can make the difference between a smooth submission and repeated revisions.
FAQs
What is a cross sectional study in simple terms?
It is a research design where data is collected from a group of participants at one specific point in time. The goal is to identify patterns or relationships between variables without tracking changes over time.
Is cross sectional study qualitative or quantitative?
It can be either, but most studies are quantitative because they rely on structured data such as surveys and numerical variables. Some researchers combine both approaches by including open-ended questions, which introduces a qualitative component. Understanding the difference is easier when comparing with approaches outlined in this guide on quantitative data analysis.
What is the difference between longitudinal vs cross sectional research?
The key difference is time. Longitudinal research follows the same participants over multiple periods, while a cross sectional approach collects data once. Longitudinal designs allow researchers to study change and causality, while cross sectional designs focus on identifying relationships at a single point in time.
When should I use this research design?
It is suitable when you need quick data collection, limited resources, or when your research focuses on prevalence, relationships, or group comparisons rather than changes over time.
What statistical tests are used for this type of data?
Common tests include:
- Chi-square for categorical variables
- Correlation for relationships
- T-tests or ANOVA for group comparisons
- Regression for prediction
Choosing the correct test is critical, and many students rely on structured approaches like those explained in this SPSS analysis guide.
Can this type of study show cause and effect?
No. It can only identify associations. Since all variables are measured at the same time, it is not possible to determine which variable came first.
What is an example of this research design?
A typical example is a survey measuring stress levels and academic performance among students during a single semester. The data is analyzed to identify relationships but not causation.
How do I choose the right sample size?
Sample size depends on your population, confidence level, and margin of error. Many students use statistical formulas such as those explained in this sample size calculation guide to ensure their results are valid.
What sampling methods are commonly used?
Researchers often use:
- Convenience sampling for accessibility
- Random sampling for representativeness
- Stratified sampling for subgroup analysis
Each method has strengths and limitations that should be clearly justified in your methodology.
How do I analyze survey data collected from this design?
Start with descriptive statistics, then apply appropriate inferential tests based on your variables. A structured step-by-step approach can be seen in this survey analysis guide, which helps avoid common errors.
What are the main advantages of this design?
It is fast, cost-effective, and allows researchers to analyze multiple variables at once. It is widely used in dissertations due to its simplicity and practicality.
What are the main limitations?
The main limitation is the inability to establish causality. Other issues include sampling bias and reliance on self-reported data.
Why do students struggle with data analysis?
Most difficulties come from selecting the wrong statistical test or misinterpreting results. This often leads to revisions or rejected chapters, especially when outputs are not explained clearly.
How do I write the results section properly?
You need to combine statistical output with interpretation. Simply presenting tables is not enough. A structured approach is outlined in this SPSS dissertation write-up guide, which shows how to present findings clearly.
What tools are best for analyzing this type of data?
SPSS is widely used because it handles large datasets, supports multiple statistical tests, and produces outputs suitable for academic reporting. Other tools like R and Jamovi are also used depending on preference and skill level.
Can I combine this design with qualitative research?
Yes. Many studies use mixed methods by combining survey data with interviews or open-ended responses. This provides deeper insight into patterns identified in the quantitative analysis.
What happens if I choose the wrong statistical test?
Using the wrong test can invalidate your findings and lead to major revisions. It is one of the most common reasons students struggle with their analysis chapters.
Is this design acceptable for dissertations?
Yes. It is one of the most commonly used research designs in undergraduate and postgraduate dissertations because it is practical and manageable within limited timeframes.
What is the fastest way to fix analysis issues?
The fastest solution is identifying the correct statistical approach and restructuring your results section. Many students resolve this by getting targeted help with dissertation data analysis, especially when deadlines are close.