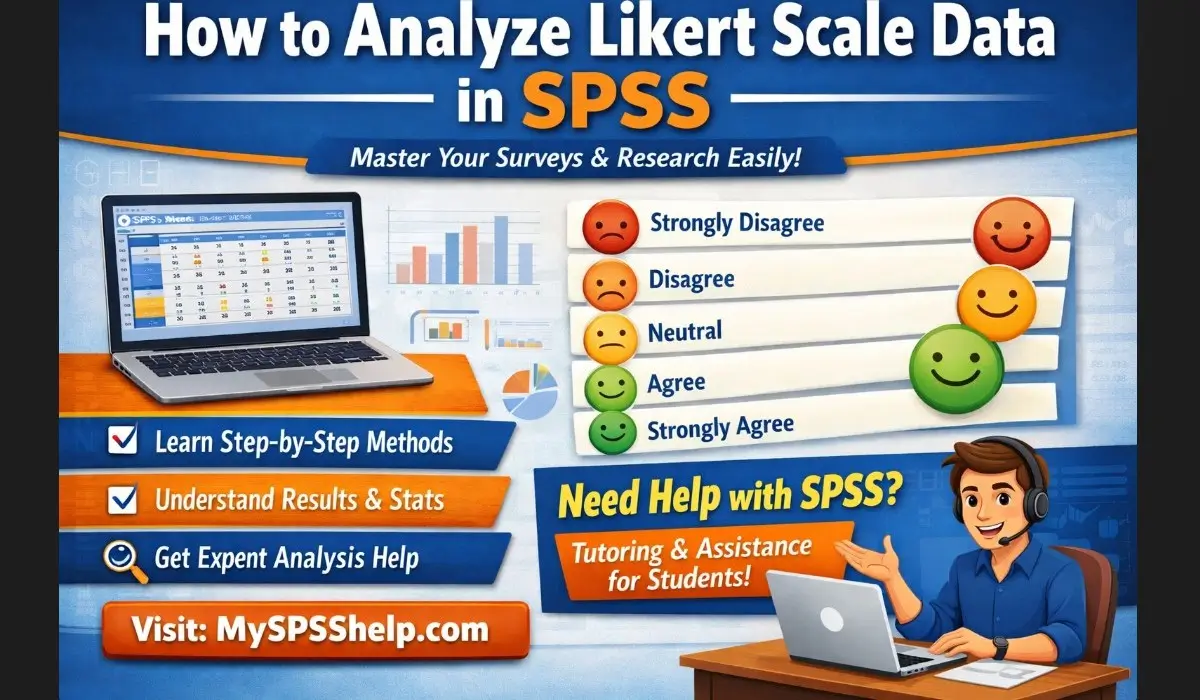
Likert scale data is widely used in surveys measuring attitudes, satisfaction, perceptions, and opinions. It is often used across education, healthcare, social sciences, and business research. Despite its popularity, many researchers are uncertain about how to analyze Likert scale data in SPSS correctly, particularly when deciding which statistics to use and how to interpret results.
Errors often arise from treating single Likert items as continuous variables, ignoring reliability testing, or applying inappropriate statistical tests. This article provides a structured, example-driven guide to analyzing Likert scale data in SPSS, from coding responses to conducting descriptive and inferential analyses.
Understanding Likert Scale Data
A Likert scale consists of ordered response categories representing increasing or decreasing levels of agreement, frequency, or intensity.
Example:
A 5-point agreement scale measuring training satisfaction may include:
1 = Strongly disagree
2 = Disagree
3 = Neutral
4 = Agree
5 = Strongly agree
Each individual Likert item is ordinal because responses have a meaningful order but unequal intervals. However, when multiple Likert items measure the same construct, such as satisfaction or motivation, researchers often combine them into a composite score. This combined score is commonly treated as approximately continuous in applied research, provided reliability is adequate.
Coding Likert Scale Responses in SPSS
Correct coding ensures that SPSS interprets Likert responses properly.
Example:
Suppose a survey includes the item:
“The training improved my job performance.”
Responses are coded in SPSS as:
1 = Strongly disagree
2 = Disagree
3 = Neutral
4 = Agree
5 = Strongly agree
In SPSS Variable View, the numeric codes are entered under the Values column so output tables display labels instead of numbers.
If the survey includes a negatively worded item such as: “The training was a waste of time.”
this item must be reverse-coded before analysis so higher values consistently indicate higher satisfaction.
Failing to reverse-code items leads to misleading scale scores and incorrect conclusions.
Descriptive Analysis of Likert Items
For individual Likert items, descriptive analysis should focus on frequencies and percentages rather than means.
Example:
For the item “The workshop met my expectations,” SPSS frequencies may show:
- Strongly agree: 42%
- Agree: 36%
- Neutral: 12%
- Disagree: 7%
- Strongly disagree: 3%
This output clearly shows that the majority of respondents responded positively. This is more informative than reporting a single mean score.
In SPSS, this analysis is conducted via Analyze > Descriptive Statistics > Frequencies.
Creating Likert Scale Scores in SPSS
When a construct is measured using multiple Likert items, it is standard practice to compute a composite score.
Example:
Training satisfaction is measured using five items:
Q1 to Q5, each scored from 1 to 5.
In SPSS, you can compute a mean satisfaction score using Transform > Compute Variable with the formula below.
Mean_Satisfaction = MEAN(Q1, Q2, Q3, Q4, Q5)
A respondent with an average score of 4.4 would be interpreted as having high satisfaction with the training.
Using a mean score allows easy interpretation and comparison across groups.
Testing Reliability Using Cronbach’s Alpha
Before using a composite Likert scale score, internal consistency must be tested.
Example:
Five satisfaction items are tested using Analyze > Scale > Reliability Analysis.
SPSS outputs a Cronbach’s alpha of 0.82.
An alpha of 0.82 indicates good internal consistency. This means the items reliably measure the same construct and can be combined into a single scale.
If alpha were 0.55, item-total statistics would need to be examined to identify items that weaken the scale.
Inferential Analysis of Likert Scale Data
The type of inferential test depends on whether you are analyzing individual items or scale scores.
Example 1: Individual Likert item
If you want to compare agreement levels between two groups using a single Likert item, a nonparametric test such as the Mann-Whitney U test is appropriate.
Example 2: Likert scale score
If a satisfaction scale score is reliable and approximately normally distributed, you may compare pre- and post-training satisfaction using a paired t test.
For instance, a mean satisfaction score increasing from 3.6 (pre-training) to 4.2 (post-training) can be tested using a paired t test in SPSS to determine whether the improvement is statistically significant.
Interpreting Likert Scale Results in SPSS
Interpretation should combine descriptive statistics, reliability evidence, and inferential results.
Example:
A satisfaction scale has a mean score of 4.18 (SD = 0.62), Cronbach’s alpha of 0.84, and a paired t test result of t(29) = 3.95, p = 0.001.
This indicates that satisfaction levels are high, the scale is reliable. The observed increase after the intervention is statistically significant.
Clear interpretation ensures that findings are meaningful and defensible.
Get Expert Help Analyzing Likert Scale Data in SPSS
If you are unsure how to analyze Likert scale data in SPSS or want to ensure your analysis meets academic and professional standards, myspsshelp.com provides expert SPSS support from start to finish. Our specialists assist with correct coding, reverse scoring, reliability testing, scale construction, and appropriate statistical analysis, along with clear interpretation and APA-compliant reporting.
If you are working on a dissertation, training evaluation, or organizational survey, we ensure your Likert scale analysis is accurate and submission-ready. Learn more about our SPSS dissertation services at Online SPSS Help.