Researchers often reach a point where a one-way ANOVA no longer answers the research question. When two or more categorical independent variables influence a single continuous outcome, factorial ANOVA becomes the correct analytical choice. In SPSS, this procedure allows researchers to test main effects and interaction effects within one coherent model.
Many students and applied researchers collect good data but lose marks or face revisions because they mis-specify factors, ignore interaction terms, or misinterpret SPSS output. These issues rarely stem from poor theory. They stem from uncertainty during execution and reporting. In theses, dissertations, and journal submissions, small mistakes in factorial designs create large problems.
This article explains how to run a factorial ANOVA using SPSS step by step. It focuses on correct model setup, interaction interpretation, UNIANOVA syntax, and APA-style reporting. Throughout the guide, examples highlight where expert statistical review prevents errors and protects academic credibility.
What Is Factorial ANOVA
Factorial ANOVA examines the effect of two or more categorical independent variables on a continuous dependent variable. Each independent variable represents a factor, and each factor includes two or more levels. Unlike one-way ANOVA, this approach evaluates interaction effects alongside main effects.
For example, a two-way design tests whether the effect of one factor changes across levels of another factor. Common layouts include 2×2 and 2×3 designs. These structures appear frequently in experimental, clinical, and social science research.
SPSS implements factorial designs through the General Linear Model framework. This framework supports between-subjects designs, repeated measures, and mixed layouts. Correct factor specification determines whether results remain valid.
When to Use This Analysis in SPSS
Researchers should use this approach when the dependent variable remains continuous and independent variables remain categorical. The design should reflect experimental manipulation or clearly defined group membership.
Between-subjects designs apply when each participant belongs to only one combination of factor levels. Mixed designs apply when one factor varies within subjects and another varies between subjects. Selecting the correct structure before analysis determines how SPSS estimates effects.
When assumptions fail or sample sizes remain small, researchers may need alternative strategies. Identifying these issues early prevents misinterpretation and unnecessary reanalysis.
Assumptions You Must Check
This analysis relies on several assumptions. The dependent variable should follow an approximately normal distribution within each group. Researchers can evaluate this condition using histograms and Q–Q plots.
The model assumes homogeneity of variances across groups. SPSS reports Levene’s test to assess this requirement. Significant results indicate unequal variances and require careful interpretation or design adjustments.
Observations must remain independent in between-subjects designs. Mixed designs explicitly address repeated measurements but still require correct specification. Severe imbalance in group sizes also weakens power and complicates interaction interpretation.
How to Run a Factorial ANOVA in SPSS
Start by preparing the dataset. Code categorical independent variables numerically and assign clear value labels. Confirm that the dependent variable uses a scale measurement level.
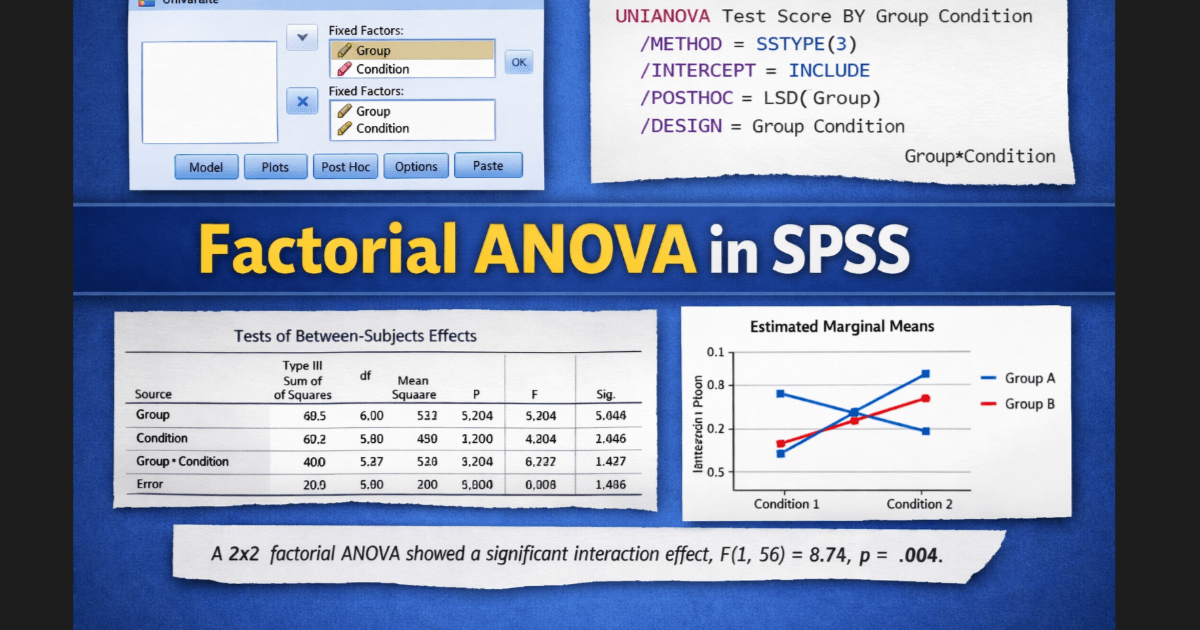
In SPSS, go to Analyze, then General Linear Model, then Univariate. Move the dependent variable into the Dependent Variable box. Move all categorical predictors into the Fixed Factor(s) box.
Click Model and select Full Factorial to include main effects and interaction terms. Under Options, request descriptive statistics, effect size estimates, homogeneity tests, and estimated marginal means. Estimated marginal means play a central role in interpretation.
SPSS Syntax for Factorial ANOVA
Using syntax improves transparency, reproducibility, and reviewer confidence. Many supervisors expect syntax-backed analysis rather than menu-only execution.
Between-subjects 2×2 design:
UNIANOVA score BY group method
  /METHOD = SSTYPE(3)
  /INTERCEPT = INCLUDE
  /PRINT = DESCRIPTIVE ETASQ HOMOGENEITY
  /CRITERIA = ALPHA(.05)
  /DESIGN = group method group*method.
Between-subjects 2×3 design:
UNIANOVA score BY treatment gender
  /METHOD = SSTYPE(3)
  /PRINT = DESCRIPTIVE ETASQ
  /DESIGN = treatment gender treatment*gender.
Always confirm that the interaction term appears in the DESIGN subcommand. Omitting the interaction invalidates interpretation.
How to Interpret SPSS Output
Interpretation begins with the Tests of Between-Subjects Effects table. Start by examining the interaction row. A significant interaction indicates that the effect of one factor depends on the level of another factor.
When an interaction reaches significance, avoid interpreting main effects in isolation. Instead, examine estimated marginal means and interaction plots. These outputs clarify how group differences change across conditions.
If the interaction does not reach significance, interpret main effects directly. Each main effect reports an F statistic, degrees of freedom, a p value, and partial eta squared. Partial eta squared strengthens reporting by quantifying effect size.
Many reporting errors occur when researchers ignore interaction terms or misread post hoc comparisons. Expert review at this stage often prevents incorrect conclusions.
Two-Way, Mixed, and Common Designs
Two-way designs represent the most common application. A 2×2 layout tests two main effects and one interaction. A 2×3 layout increases complexity by adding additional group comparisons.
Mixed ANOVA designs include both between-subjects and within-subjects factors. SPSS handles these designs through the Repeated Measures option in the General Linear Model. Correct factor definition determines whether results remain valid.
As complexity increases, interpretation becomes more demanding. Careful plotting and structured reporting separate strong analyses from confusing ones.
Nonparametric Alternatives
SPSS does not provide a direct nonparametric equivalent for factorial designs. Researchers may need to consider aligned rank transform methods or generalized linear models when assumptions fail.
Switching methods requires strong justification. Poorly chosen alternatives weaken conclusions and invite reviewer criticism.
How to Report Results in APA Style
APA-style reporting requires clarity and precision. Report the design, test statistics, effect sizes, and significance levels.
Example:
“A two-way analysis examined the effects of teaching method and class size on test performance. The interaction reached significance, F(1, 96) = 5.42, p = .022, partial η² = .05. Simple effects analysis showed that interactive instruction improved scores only in small classes.”
Mixed designs require additional reporting of within-subjects effects and corrections when applicable.
From Analysis to Confident Submission
Many readers understand the theory but struggle with execution, interpretation, and reporting. These gaps create risk during thesis defense, dissertation review, and peer review.
If you want this analysis set up correctly, interpreted accurately, and reported to academic standards, expert SPSS support removes uncertainty and saves time. Professional review ensures that interaction effects, post hoc tests, and reporting align with reviewer expectations.
Conclusion
Factorial designs allow researchers to study complex relationships within a single model. SPSS provides the tools to run these analyses effectively, but accuracy depends on correct setup and disciplined interpretation.
Researchers who rush through this process often misinterpret interactions or report incomplete results. Those who approach it strategically produce clear, defensible findings. When deadlines and academic credibility matter, expert guidance turns complex output into confident conclusions.