The paired sample t test in SPSS is one of the most commonly used statistical techniques for comparing two related measurements taken from the same subjects. It is widely applied in psychology, nursing, education, public health, and experimental research where pre-test and post-test designs are standard. When used correctly, it provides a precise method for evaluating whether a meaningful change has occurred between two time points or conditions.
This guide explains what a paired sample t test is in SPSS, how to run it step by step, how to read and interpret the SPSS output, and how to report results correctly for theses, dissertations, and journal articles.
What Is Paired Sample t Test in SPSS?
A paired sample t test compares the means of two related variables. These variables represent measurements taken from the same participants under two conditions or at two time points.
Common examples include:
- Test scores before and after an intervention
- Anxiety levels measured pre-treatment and post-treatment
- Blood pressure readings before and after medication
- Performance scores under two experimental conditions applied to the same group
In SPSS, this test is sometimes called the dependent t test or repeated measures t test, but the underlying logic remains the same: the comparison is within subjects, not between independent groups.
When to Use a Paired Sample t Test in SPSS
You should use a paired sample t test in SPSS when:
- The same participants are measured twice
- The dependent variable is continuous
- The two measurements are logically paired
- You want to test whether the mean difference between the two measurements is statistically significant
If your design includes more than two time points, repeated measures ANOVA is the appropriate alternative.
How to Run a Paired Sample t Test in SPSS
Step 1: Prepare Your Data
Your dataset must be in wide format, with each measurement in a separate column.
Example:
- Score_Pre
- Score_Post
Each row represents one participant.
Step 2: Navigate to the Test
- Click Analyze
- Select Compare Means
- Choose Paired-Samples T Test
Step 3: Define the Pair
Move the two related variables into the Paired Variables box in the correct order.
Step 4: Run the Test
Click OK to generate the output.
SPSS will automatically produce three key tables for interpretation.
How to Read Paired Sample t Test SPSS Output
Knowing how to read paired sample t test SPSS output is essential for accurate conclusions.
Paired Samples Statistics Table
This table shows:
- Mean for each measurement
- Standard deviation
- Sample size
It helps you understand the direction of change between the two conditions.
Paired Samples Correlations Table
This table reports the correlation between the two measurements. While informative, it does not affect the t test result and should not be overemphasized.
Paired Samples Test Table
This is the most important table.
Key columns include:
- Mean difference
- Standard deviation of the difference
- t value
- Degrees of freedom
- Sig. (2-tailed)
The p-value determines whether the difference between the paired means is statistically significant.
Assumptions of Paired Sample t Test in SPSS
Before running the analysis, confirm that the assumptions are satisfied:
- The dependent variable is continuous
- Observations are paired and come from the same subjects
- The differences between paired observations are approximately normally distributed
- There are no extreme outliers in the difference scores
SPSS does not automatically test normality of differences, so this should be checked using histograms, Q–Q plots, or the Shapiro–Wilk test.
Paired Sample t Test SPSS Interpretation
Correct paired sample t test SPSS interpretation follows a clear sequence:
- Identify the direction of the mean difference
- Examine the t value and degrees of freedom
- Evaluate the p-value
- Decide whether the difference is statistically significant
Example interpretation:
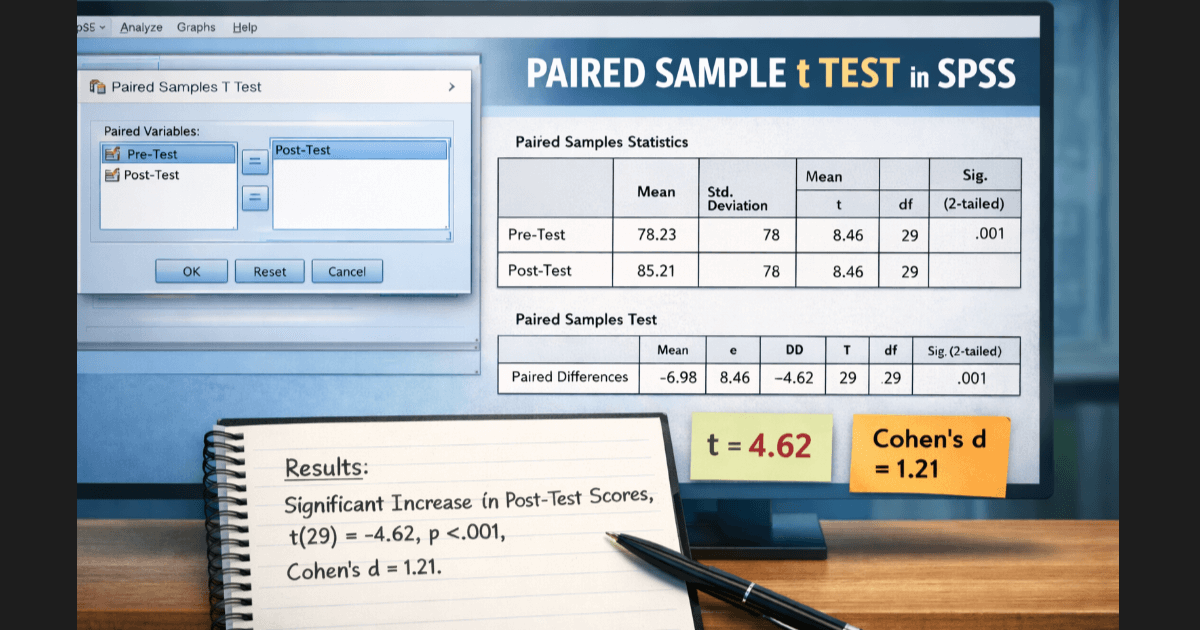
A paired sample t test showed a significant difference between pre-test and post-test scores, t(29) = 4.62, p < .001, indicating a statistically significant improvement after the intervention.
This format is appropriate for theses, dissertations, and journal submissions.
Effect Size for Paired Sample t Test in SPSS
Statistical significance alone does not indicate practical importance. Effect size explains how large the change actually is.
For paired sample t tests, effect size is commonly reported as Cohen’s d.
General guidelines:
- 0.20 = small effect
- 0.50 = medium effect
- 0.80 = large effect
SPSS does not automatically report Cohen’s d, but it can be calculated manually using the mean difference and standard deviation of the differences.
Reporting Paired Sample t Test Results
A standard APA-style report includes:
- Test type
- t value
- Degrees of freedom
- p-value
- Direction of effect
- Effect size if required
Example:
A paired sample t test indicated a significant reduction in stress scores following treatment, t(24) = 3.98, p = .001, Cohen’s d = 0.81.
Common Mistakes
Researchers frequently make avoidable errors, including:
- Using an independent samples t test instead of a paired test
- Ignoring outliers in difference scores
- Misreporting degrees of freedom
- Failing to include effect size
- Misinterpreting non-significant results as “no effect”
These mistakes can weaken a dissertation or raise concerns during review.
When You Need Expert SPSS Help
Although the t test appears simple, students often struggle with assumption checks, effect size calculation, and correct interpretation. Errors at this stage can compromise an entire results chapter.
Professional SPSS dissertation help ensures that your t test is run correctly, interpreted accurately, and reported in line with academic and APA standards.
Conclusion
The t test in SPSS is a powerful method for comparing two related measurements, particularly in pre-test and post-test research designs. Understanding what a paired sample t test is in SPSS, how to run it, how to read the output, and how to interpret the results ensures accurate and defensible conclusions.
When precision matters, especially in thesis and dissertation work, correct application and interpretation make all the difference.