ANCOVA in SPSS confuses many dissertation and thesis students because it combines concepts from both ANOVA and regression. Most students understand basic ANOVA until they encounter covariates, adjusted means, homogeneity of regression slopes, and assumption testing.
The confusion becomes worse when supervisors ask students to:
- Control for baseline differences
- Include covariates in the model
- Interpret adjusted means
- Explain ANCOVA assumptions
- Report SPSS output academically
- Justify why ANCOVA was selected
Many students also struggle because SPSS outputs multiple tables that appear highly technical. One small interpretation mistake can affect the validity of the dissertation findings chapter.
This guide explains:
- How to ANCOVA SPSS correctly
- ANCOVA assumptions
- How to interpret ANCOVA SPSS output
- Common dissertation mistakes
- Repeated measures ANCOVA SPSS interpretation
- Two-way ANCOVA SPSS
- Nonparametric ANCOVA SPSS alternatives
Students who are already overwhelmed with dissertation statistics often need more than just a tutorial. They need practical help understanding what the output actually means and how to report it correctly.
At myspsshelp.com, we help students with SPSS analysis, dissertation statistics, interpretation, and Chapter 4 reporting when they feel stuck with complex analyses such as ANCOVA.
What Is ANCOVA in SPSS?
ANCOVA stands for Analysis of Covariance. It combines:
- ANOVA (Analysis of Variance)
- Linear regression concepts
ANCOVA evaluates whether group means differ while statistically controlling for the influence of one or more covariates.
In simple terms, ANCOVA removes the effect of external variables that may influence the dependent variable.
Example of ANCOVA in Dissertation Research
Imagine a researcher studying whether three teaching methods affect exam scores.
However, students already had different baseline abilities before the intervention. The researcher uses pre-test scores as a covariate to control for those initial differences.
In this situation:
- Independent variable = Teaching method
- Dependent variable = Final exam score
- Covariate = Pre-test score
ANCOVA helps determine whether the teaching methods still differ after adjusting for baseline ability.
This makes ANCOVA extremely useful in:
- Healthcare research
- Psychology studies
- Education research
- Clinical trials
- Behavioral sciences
Students conducting experimental or quasi-experimental research often combine ANCOVA with concepts discussed in ANOVA vs regression, one-way ANOVA SPSS, and factorial ANOVA SPSS.
Why Dissertation Students Use ANCOVA
Many dissertations involve groups that already differ before treatment or intervention. ANCOVA helps reduce bias by adjusting for those differences statistically.
Students commonly use ANCOVA when:
- Comparing intervention groups
- Adjusting for baseline scores
- Controlling demographic variables
- Reducing experimental error
- Improving statistical power
Common covariates include:
- Age
- Income
- Pre-test scores
- GPA
- Baseline measurements
- Prior experience
Unfortunately, many students misuse covariates or fail to check assumptions properly, which creates major problems during supervisor review.
How to Run ANCOVA in SPSS
Students searching for “how to run ANCOVA SPSS” or “how to ANCOVA SPSS” usually struggle because tutorials skip interpretation and focus only on clicking menus.
Step 1: Open the ANCOVA Menu
In SPSS:
- Click Analyze
- Select General Linear Model
- Choose Univariate
Step 2: Assign Variables
- Move the dependent variable into the Dependent Variable box
- Move the grouping variable into Fixed Factor(s)
- Move the covariate into Covariate(s)
Step 3: Configure Options
Students should request:
- Descriptive statistics
- Parameter estimates
- Homogeneity tests
- Effect sizes
- Estimated marginal means
Step 4: Run the Analysis
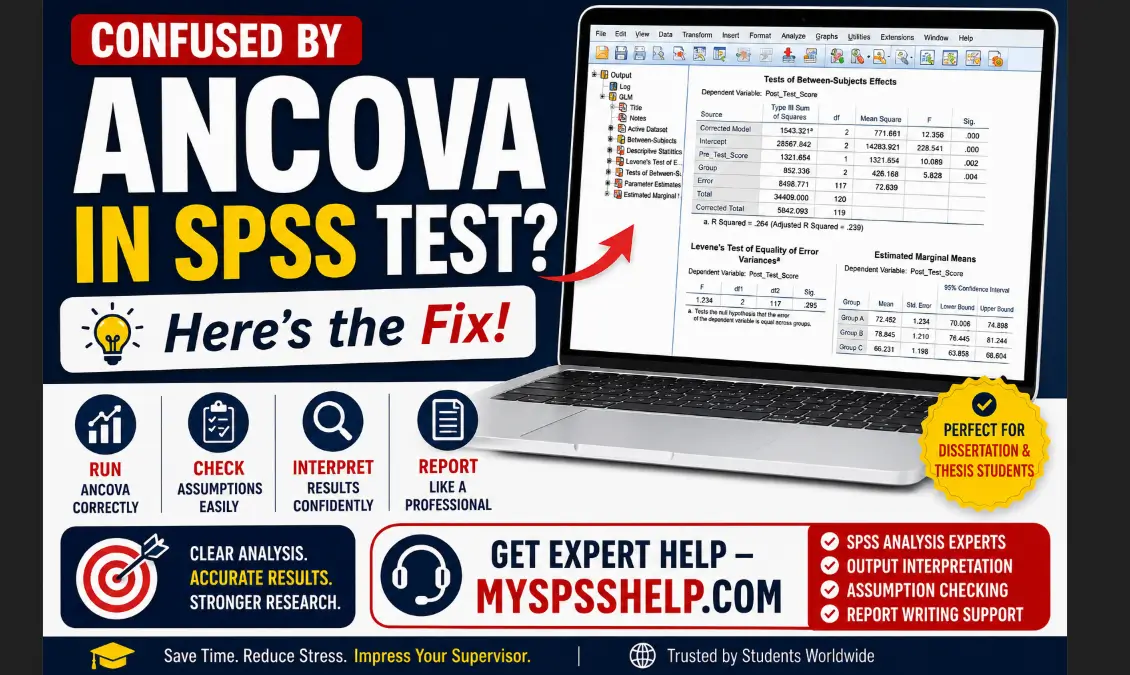
SPSS will generate multiple tables including:
- Tests of Between-Subjects Effects
- Levene’s test
- Parameter estimates
- Estimated marginal means
This is usually where students become confused.
ANCOVA SPSS Assumptions
Many dissertation students lose marks because they ignore assumptions entirely.
ANCOVA assumptions include:
Normality
The dependent variable should be approximately normally distributed.
Students can evaluate this using:
- Histograms
- Q-Q plots
- Shapiro-Wilk tests
Students struggling with assumption testing may also review normality test SPSS.
Homogeneity of Variance
Groups should have similar variances.
SPSS evaluates this using Levene’s Test.
Linearity
The covariate should have a linear relationship with the dependent variable.
Independence of Observations
Observations must remain independent.
Homogeneity of Regression Slopes ANCOVA SPSS
This assumption causes major confusion for students.
Homogeneity of regression slopes ANCOVA SPSS means the relationship between the covariate and dependent variable should remain similar across groups.
If this assumption fails:
- ANCOVA results may become invalid
- Interpretation becomes problematic
- Alternative approaches may become necessary
Many students panic when they see interaction effects become significant because they do not understand what the assumption actually means.
How to Interpret ANCOVA SPSS Output
Students searching for:
- interpret ANCOVA SPSS output
- ANCOVA SPSS output interpretation
- how to interpret ANCOVA SPSS
usually struggle because SPSS tables contain many statistics simultaneously.
Tests of Between-Subjects Effects
This table contains:
- F-statistics
- Significance values
- Partial eta squared
- Adjusted effects
Students should focus on:
- Whether the independent variable remains significant after controlling for the covariate
- Effect size interpretation
- Statistical significance
Estimated Marginal Means
These are adjusted group means after controlling for the covariate.
Many students incorrectly interpret raw means instead of adjusted means.
Parameter Estimates
This section explains:
- Regression coefficients
- Direction of effects
- Influence of covariates
Students often misinterpret coefficients because they confuse ANCOVA with simple regression.
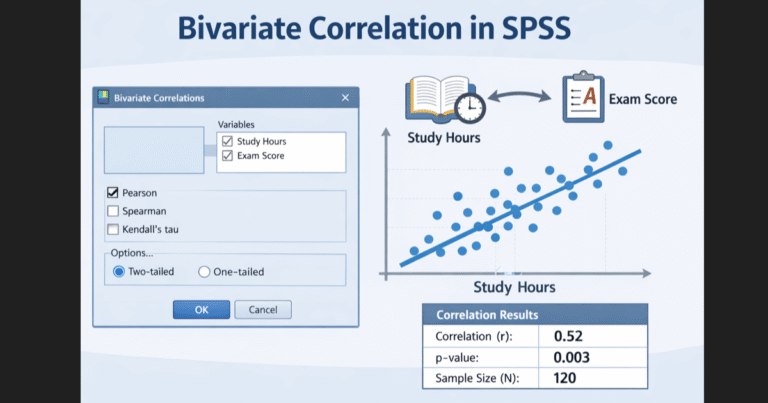
ANCOVA SPSS Output Interpretation Example
Imagine a study comparing three therapy groups after controlling for baseline anxiety scores.
SPSS may show:
- F(2, 117) = 5.82
- p = .004
- Partial eta squared = .09
This means:
- Significant differences exist between therapy groups
- The covariate-adjusted group means differ
- The treatment effect remains statistically significant after controlling for baseline anxiety
The challenge for dissertation students is converting technical SPSS output into clear academic writing.
Students often need help with:
- APA formatting
- Results interpretation
- Chapter 4 writing
- Statistical reporting
Our guides on SPSS report writing and how to write up a dissertation analysis using SPSS help students transform SPSS output into professional academic reporting.
Repeated Measures ANCOVA SPSS
Repeated measures ANCOVA SPSS becomes more advanced because the same participants are measured across multiple time points while controlling for covariates.
Students commonly use repeated measures ANCOVA in:
- Clinical interventions
- Educational programs
- Longitudinal studies
- Pre-test/post-test research
Repeated measures ANCOVA SPSS interpretation often confuses students because outputs include:
- Within-subject effects
- Between-subject effects
- Interaction terms
- Covariate adjustments
Students already struggling with repeated measures designs may also review repeated measures ANOVA SPSS and mixed ANOVA in SPSS.
Two-Way ANCOVA SPSS
Two-way ANCOVA SPSS includes:
- Two independent variables
- One or more covariates
Students use two-way ANCOVA when evaluating:
- Main effects
- Interaction effects
- Covariate-adjusted group differences
For example:
- Gender × treatment effects
- Teaching method × learning style
- Intervention × age category
Many students struggle because interaction interpretation becomes much more difficult once covariates enter the model.
Three Way ANCOVA SPSS
Three way ANCOVA SPSS becomes highly complex because it evaluates:
- Three independent variables
- Multiple interaction effects
- Covariate-adjusted relationships
Most undergraduate and many master’s students struggle heavily with three-way ANCOVA interpretation because outputs become difficult to explain academically.
This is one reason many students seek professional SPSS help before thesis submission.
Nonparametric ANCOVA SPSS
Students frequently search for:
- nonparametric ANCOVA SPSS
- non-parametric ANCOVA SPSS
- quade nonparametric ANCOVA SPSS
because ANCOVA assumptions sometimes fail.
SPSS does not offer a direct nonparametric ANCOVA procedure in the same way it offers nonparametric ANOVA alternatives.
Researchers may instead consider:
- Rank transformation methods
- Quade’s ANCOVA
- Generalized linear models
- Robust statistical alternatives
Students dealing with non-normal data may also explore Kruskal-Wallis test, Mann-Whitney U in SPSS, and nonparametric correlation SPSS.
Simple Effects ANCOVA SPSS
Simple effects ANCOVA SPSS examines subgroup differences after significant interactions occur.
This analysis becomes relevant when:
- Interaction effects are significant
- Researchers need deeper interpretation
- Group comparisons become conditional
Many students misunderstand interaction effects entirely, which creates incorrect conclusions in dissertation chapters.
Common ANCOVA SPSS Mistakes Dissertation Students Make
Ignoring Assumptions
Skipping homogeneity tests or normality checks weakens validity.
Misusing Covariates
Some students include variables that should not function as covariates.
Interpreting Raw Means Instead of Adjusted Means
ANCOVA interpretation should focus on adjusted means.
Confusing ANCOVA With Regression
Although ANCOVA uses regression concepts, interpretation differs.
Incorrect APA Reporting
Students often report ANCOVA findings incompletely or incorrectly.
Why Students Seek ANCOVA SPSS Help
ANCOVA is not difficult because of the menu clicks. It becomes difficult because students must understand:
- Research design
- Covariate logic
- Assumptions
- Statistical interpretation
- Academic reporting
Many students contact myspsshelp.com after:
- Receiving supervisor corrections
- Failing assumptions
- Misinterpreting SPSS output
- Struggling with Chapter 4
- Running the wrong analysis
We help students with:
- ANCOVA SPSS analysis
- Repeated measures ANCOVA
- Two-way ANCOVA
- SPSS interpretation
- APA reporting
- Dissertation Chapter 4 writing
- Statistical troubleshooting
Students needing broader support may also explore:
IBM also provides official guidance on General Linear Models and ANCOVA procedures in SPSS Statistics documentation. IBM SPSS Statistics GLM Documentation
Laerd Statistics also explains ANCOVA assumptions and interpretation concepts commonly encountered in dissertation research. Laerd Statistics ANCOVA Guide
Final Thoughts on ANCOVA SPSS
ANCOVA SPSS becomes much easier once students understand that the analysis adjusts group comparisons while controlling for covariates.
The major challenge is rarely running the procedure itself. The real difficulty involves:
- Selecting proper covariates
- Testing assumptions
- Understanding adjusted means
- Interpreting output correctly
- Reporting results academically
Students who ignore these areas often receive major dissertation corrections.
Whether you are struggling with:
- repeated measures ANCOVA SPSS interpretation,
- homogeneity of regression slopes ANCOVA SPSS,
- ANCOVA SPSS output interpretation,
- or two-way ANCOVA SPSS,
professional statistical guidance can save significant time and reduce dissertation stress.
At myspsshelp.com, we help dissertation and thesis students complete accurate SPSS analysis, understand complex outputs, and prepare professionally written findings chapters confidently.
FAQs
What is ANCOVA and when should students use it?
ANCOVA helps researchers compare group means while controlling for variables that may influence the outcome. Students commonly use it in thesis and dissertation research when they want to reduce bias caused by factors such as age, baseline scores, GPA, or prior knowledge.
What is the difference between ANOVA and ANCOVA?
ANOVA compares group differences directly, while ANCOVA adjusts those comparisons after controlling for external variables known as covariates. This adjustment often improves the accuracy of research findings.
Why do dissertation students struggle with this analysis?
Many students struggle because the procedure combines concepts from both ANOVA and regression. The biggest challenges usually involve:
- Choosing appropriate covariates
- Checking assumptions
- Understanding adjusted means
- Interpreting SPSS output
- Writing Chapter 4 findings correctly
How do I run the analysis in SPSS?
Students can run the procedure through:
- Analyze
- General Linear Model
- Univariate
After selecting the dependent variable, independent variable, and covariate, SPSS generates several output tables for interpretation.
What are covariates?
Covariates are variables that may influence the dependent variable but are not the main focus of the study. Common examples include:
- Pre-test scores
- Age
- Income
- Baseline measurements
- Previous experience
What assumptions should students check?
The major assumptions include:
- Normality
- Homogeneity of variance
- Linearity
- Independence of observations
- Homogeneity of regression slopes
Ignoring these assumptions can weaken the validity of dissertation findings.
What does homogeneity of regression slopes mean?
This assumption means the relationship between the covariate and dependent variable should remain consistent across all groups being compared. If this assumption fails, the analysis may not be appropriate.
How do I interpret the output correctly?
Students should focus on:
- F-values
- p-values
- Effect sizes
- Adjusted means
- Significance levels
The key goal is determining whether group differences remain significant after controlling for the covariate.
What are adjusted means?
Adjusted means are group means that have been statistically corrected after accounting for the covariate. These values provide a more accurate comparison between groups.
What is repeated measures ANCOVA?
This approach analyzes repeated observations over time while controlling for one or more covariates. Researchers often use it in:
- Clinical trials
- Educational interventions
- Longitudinal studies
- Pre-test/post-test designs
What is two-way ANCOVA?
Two-way designs involve:
- Two independent variables
- One dependent variable
- One or more covariates
Researchers use this approach to evaluate both main effects and interaction effects simultaneously.
Is there a nonparametric alternative?
Yes. When assumptions such as normality are violated, researchers may consider alternatives such as:
- Quade’s method
- Rank-based procedures
- Robust statistical models
These approaches help analyze group differences without relying heavily on parametric assumptions.
Why do students often misinterpret the results?
Many students can run the procedure technically but struggle to explain:
- Statistical significance
- Effect sizes
- Interaction effects
- Adjusted group differences
- Practical meaning of the findings
This becomes especially difficult during thesis and dissertation reporting.
Can this analysis improve research quality?
Yes. Controlling for external influences often strengthens internal validity and produces more accurate group comparisons, especially in experimental and quasi-experimental studies.
What should I do if assumptions fail?
Students may need to:
- Transform variables
- Remove extreme outliers
- Use robust alternatives
- Reconsider the research design
- Explore nonparametric methods
Assumption violations should never be ignored because they can affect the credibility of the findings.
Can students get help with interpretation and reporting?
Many thesis and dissertation students seek help with:
- Output interpretation
- Assumption testing
- Chapter 4 writing
- APA formatting
- Statistical troubleshooting
- Supervisor corrections
Professional guidance can help students avoid major interpretation errors and improve the overall quality of their research reporting.