Reaching the data analysis stage of a dissertation should feel like real progress. However, for many Master’s and PhD students, this phase quickly becomes confusing and overwhelming.
You may have already collected your data, completed your questionnaires, and gathered enough responses. Yet, once you open SPSS, you encounter numerous statistical tests, complex output tables, significance values, coefficients, and assumptions that require careful interpretation.
So, which statistical test actually answers your research question? Should you choose correlation or regression? Is ANOVA the right option? More importantly, what does a p-value really mean for your hypothesis? And which SPSS tables should appear in Chapter 4?
If these questions are slowing your progress, professional dissertation data analysis help can guide you from raw data and unclear output to accurate, well-explained findings.
At MySPSSHelp.com, students and researchers receive tailored support with data cleaning, statistical test selection, SPSS analysis, interpretation, and results reporting. Importantly, every analysis aligns with your research objectives, hypotheses, variables, methodology, and university requirements.
Need help analyzing your dissertation data? Get expert support with your SPSS analysis, interpretation, and results chapter today.
What Is Dissertation Data Analysis Help?
Dissertation data analysis help provides professional statistical and research support for students who need assistance transforming collected data into meaningful findings.
Typically, this support covers the entire analysis process, including:
- Reviewing research questions and hypotheses
- Checking dataset structure and quality
- Cleaning and coding data
- Selecting appropriate statistical tests
- Testing statistical assumptions
- Running analysis in SPSS
- Interpreting statistical output
- Creating clear tables and figures
- Reporting findings in academic style
- Structuring the results chapter
- Addressing supervisor feedback
A dissertation represents a major research project completed during undergraduate or postgraduate study. Therefore, the findings must directly answer the research question or test the proposed hypotheses.
For this reason, data analysis should never involve randomly running tests in SPSS and copying tables into your dissertation. Instead, every analytical decision must connect logically to your study design, variables, and research objectives.
If you need more comprehensive support, you can explore our dissertation data analysis services or dissertation statistics help.
Why Is Dissertation Data Analysis So Difficult?
Opening SPSS and clicking through menus is rarely the main challenge. Instead, the real difficulty lies in making correct analytical decisions throughout the process.
For instance, you might know how to generate a regression table but still struggle with key questions:
- Does regression align with your research objective?
- Are your variables measured correctly?
- Have you checked all necessary assumptions?
- Which statistics should you report?
- What do the coefficients mean in context?
- Does the result support your hypothesis?
- How should you present the findings academically?
Even a single incorrect decision can affect your entire results chapter.
For example, selecting the wrong statistical test may produce convincing output that fails to answer your research question. Likewise, even statistically significant results can lose value if you interpret them poorly.
As a result, many students seek dissertation data analysis help after spending days trying to understand SPSS output.
Get Dissertation Data Analysis Help Before Small Errors Affect Your Results
Often, data analysis problems begin long before interpretation.
For example, you might code a variable incorrectly. Alternatively, you may mishandle missing values or overlook reverse-coded items. In some cases, students select incorrect dependent or independent variables. Additionally, ignoring assumptions or reporting p-values without interpretation can weaken your analysis.
Over time, these issues become harder to fix, especially after writing an entire Chapter 4 based on flawed analysis.
Therefore, getting help early allows you to identify and correct problems before they affect multiple sections of your dissertation.
At MySPSSHelp.com, we provide thesis data analysis help tailored to your specific research requirements. Rather than applying generic templates, we base every analysis on your objectives, hypotheses, methodology, and dataset.
How Dissertation Data Analysis Help Works
A strong dissertation analysis follows a structured process. Although each study differs, most quantitative analyses include several key stages.
1. Reviewing Your Research Questions and Hypotheses
First, you must clearly understand what your dissertation aims to investigate.
Your research questions and hypotheses directly influence the statistical methods you should use. For example, your study may examine:
- Relationships between variables
- Predictive effects
- Differences between groups
- Associations involving categorical outcomes
- Measurement reliability
Because each scenario differs, each requires a specific analytical approach.
Therefore, effective dissertation analysis help always begins with your research framework rather than jumping straight into SPSS.
2. Checking and Cleaning the Dissertation Dataset
Next, you must prepare your dataset properly.
Raw data rarely arrives ready for analysis. Instead, you should check for:
- Missing values
- Duplicate entries
- Invalid responses
- Coding errors
- Inconsistent labels
- Outliers
- Incorrect data types
Without proper cleaning, your results may become unreliable.
Additionally, well-designed surveys can prevent many of these issues. If you are still preparing your instrument, consider our survey design or SurveyMonkey setup services.
3. Choosing the Right Statistical Tests
Selecting the correct test remains one of the most common challenges.
The appropriate method depends on several factors, including:
- Your research question
- Study design
- Number of variables
- Measurement levels
- Data distribution
- Group comparisons
- Statistical assumptions
Depending on your study, you may use descriptive statistics, t-tests, ANOVA, chi-square tests, correlation, regression, or factor analysis.
For example, if your research involves prediction, our SPSS regression analysis help can guide you. Similarly, for binary outcomes, you may need binary logistic regression support.
Ultimately, your goal is not to choose the most advanced method but to select the most appropriate one.
4. Running the Analysis in SPSS
SPSS is a widely used statistical tool that supports data preparation, testing, and modeling. You can explore its capabilities through IBM SPSS Statistics.
However, running tests alone is not enough.
Depending on your research, you may perform:
- Descriptive statistics
- Correlation analysis
- T-tests
- ANOVA
- Regression models
- Chi-square tests
- Reliability analysis
Importantly, each procedure must align with your methodology.
If SPSS itself feels overwhelming, you can access online SPSS help or assignment support.
5. Checking Statistical Assumptions
Before interpreting results, you must verify assumptions.
For example, you may need to assess:
- Normality
- Linearity
- Homogeneity of variance
- Independence
- Multicollinearity
Each statistical test requires different checks. Therefore, understanding these requirements strengthens your analysis and improves credibility.
6. Interpreting SPSS Output Correctly
Many students struggle most at this stage.
SPSS generates multiple tables, but not all of them belong in your dissertation. Instead, you should focus on key statistics and explain their meaning clearly.
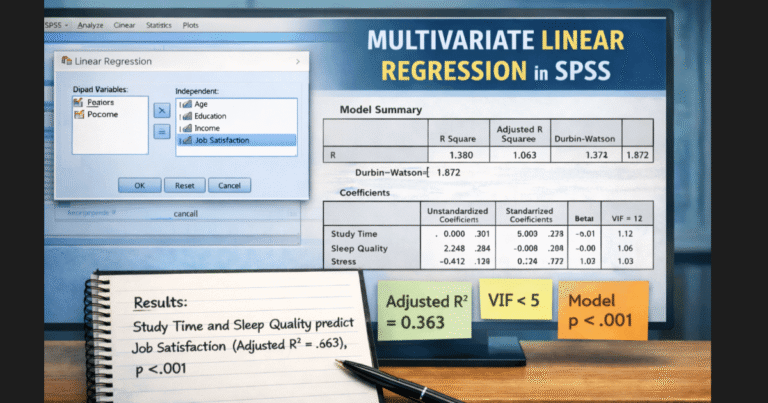
For instance, regression analysis involves interpreting R values, coefficients, significance levels, and confidence intervals. Similarly, ANOVA requires understanding group differences and post hoc results.
Rather than simply stating “p < .05,” you should explain what the result means for your research question.
If you already have output but need help interpreting it, consider our SPSS analysis support.
How to Write Dissertation Data Analysis Results
Once you complete your analysis, you must present your findings clearly.
Typically, the results chapter follows your research questions or hypotheses.
Sample Characteristics
Start by describing your participants. Include relevant demographics such as age, gender, or education level.
Descriptive Statistics
Next, summarize your variables using means, frequencies, and standard deviations.
Reliability Results
If you used scales, report reliability measures such as Cronbach’s alpha.
Hypothesis Testing
Finally, present your statistical tests. Clearly explain what you tested, which method you used, and what the results mean.
Additionally, follow APA reporting standards to ensure clarity and consistency.
What Should You Include From SPSS in Chapter 4?
Avoid copying entire SPSS outputs into your dissertation.
Instead, include only relevant statistics such as:
- Key descriptive results
- Test statistics
- p-values
- Effect sizes
- Confidence intervals
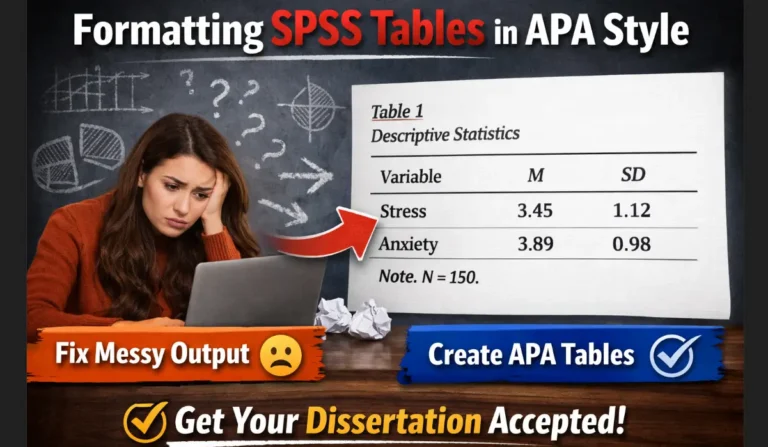
Well-organized tables improve readability and strengthen your presentation.
Common Dissertation Data Analysis Mistakes
Students often encounter similar issues.
For example, some choose tests based on previous dissertations rather than their own research design. Others ignore assumptions or include unnecessary tables.
Additionally, many students confuse results with discussion or report significance without interpretation.
To avoid these mistakes, always align your analysis with your research objectives.
Dissertation Data Analysis Help for Master’s and PhD Students
As you progress academically, expectations increase.
Master’s students must demonstrate correct method selection and interpretation. Meanwhile, PhD candidates often handle more complex models and detailed justifications.
MySPSSHelp.com provides tailored support for both levels.
Dissertation Data Analysis Help for Students Worldwide
Students from different countries face varying requirements.
Therefore, MySPSSHelp.com offers online support to students worldwide, including the UK, US, Canada, Australia, and beyond.
Regardless of your location, you can share your dataset and receive personalized assistance.
What You Receive With Our Dissertation Data Analysis Help
Depending on your needs, support may include:
- Data cleaning
- Statistical testing
- SPSS analysis
- Interpretation
- Results chapter writing
Additionally, we offer support for R and Stata if required.
Why Choose MySPSSHelp.com?
We tailor every analysis to your research.
Moreover, we provide clear explanations, structured results, and flexible support at any stage of your dissertation.
Need Urgent Dissertation Data Analysis Help?
Deadlines can quickly become stressful.
However, you do not need to struggle alone. Instead of guessing your way through SPSS, you can get expert guidance.
Send your dataset and requirements today.
Conclusion
Dissertation data analysis transforms raw data into meaningful findings.
To achieve accurate results, you must prepare your data carefully, choose appropriate methods, and interpret findings correctly.
If you feel stuck, professional dissertation data analysis help can save time and improve your results.
Start today and turn your data into clear, reliable research findings.
Frequently Asked Questions
What is dissertation data analysis help?
Dissertation data analysis help is professional support that assists students in preparing, analyzing, interpreting, and presenting research data. It includes data cleaning, statistical testing, SPSS analysis, and results reporting.
Can someone help me analyze my dissertation data?
Yes. Experts can guide you through selecting appropriate statistical tests, running analysis in SPSS, and interpreting results based on your research questions and methodology.
Which statistical test should I use for my dissertation?
The correct test depends on your research question, variables, and study design. Common tests include correlation, regression, t-tests, ANOVA, and chi-square analysis.
Can I get help with SPSS for my dissertation?
Yes. SPSS support includes data preparation, statistical testing, output interpretation, and assistance with writing your results chapter.
How do I interpret SPSS output?
You should focus on key statistics such as p-values, coefficients, and test statistics. Interpretation should explain what the results mean in relation to your research question.
What should I include in Chapter 4?
Include relevant descriptive statistics, hypothesis test results, and clear explanations. Avoid copying full SPSS outputs and instead present only essential findings.
Can you help with dissertation data cleaning?
Yes. Data cleaning includes checking for missing values, coding errors, duplicates, and inconsistencies to ensure accurate analysis.
Do you provide help for Master’s and PhD dissertations?
Yes. Support is available for undergraduate, Master’s, and PhD students, tailored to the complexity of each research project.
Is dissertation data analysis help available online?
Yes. You can receive support online by sharing your dataset, research questions, and requirements from anywhere in the world.
How quickly can I get help?
Turnaround time depends on your project complexity and deadline. Urgent support is available for students facing tight submission timelines.