One way ANOVA in SPSS allows researchers to compare the means of three or more independent groups on a single continuous outcome. Many students and researchers seek online SPSS assistance when interpreting ANOVA outputs for academic projects.
This guide explains how to do a one way ANOVA in SPSS, how to define the factor, how to read SPSS output tables, how to interpret results correctly, how to calculate effect size, and how to run multiple comparisons without errors.
What Is One Way ANOVA in SPSS?
One way ANOVA tests whether at least one group mean differs significantly from the others. The analysis evaluates one independent variable, called a factor, that contains three or more levels.
For example, a researcher may compare exam scores across three teaching methods or measure blood pressure across different treatment groups. Instead of running multiple t tests, one way ANOVA controls Type I error while testing all group differences simultaneously.
SPSS performs one way ANOVA through the Compare Means framework.
When to Use One Way ANOVA in SPSS
Researchers should use one way ANOVA in SPSS when:
- The dependent variable is continuous
- The independent variable is categorical with three or more groups
- Observations remain independent
- The goal involves comparing group means
If only two groups exist, an independent samples t test is more appropriate.
Assumptions of One Way ANOVA in SPSS
Before interpretation, researchers must verify that the data meet all assumptions.
Normality
Each group should show an approximately normal distribution. Researchers can assess this using histograms or Shapiro–Wilk tests.
Homogeneity of Variance
Groups should display similar variances. SPSS tests this assumption using Levene’s Test.
Independence
Each observation must belong to only one group. Study design ensures this assumption.
Factor in One Way ANOVA SPSS
In SPSS, the factor represents the independent grouping variable. This variable must be categorical and coded correctly.
Example:
- Teaching Method (1 = Online, 2 = Hybrid, 3 = In-Person)
SPSS treats each value as a separate group during analysis.
How to Do One Way ANOVA SPSS (Step-by-Step)
To run the analysis correctly, follow these one way ANOVA SPSS steps.
- Click Analyze
- Select Compare Means
- Choose One-Way ANOVA
Next, move the continuous outcome variable into the Dependent List. After that, move the grouping variable into the Factor box.
Click Options and select:
- Descriptive statistics
- Homogeneity of variance test
Then click Post Hoc and choose:
- Tukey (if variances are equal)
- Games-Howell (if variances are unequal)
Finally, click OK to run the analysis.
One Way ANOVA SPSS Output Explained
Understanding one way ANOVA SPSS output prevents misinterpretation.
Descriptives Table
This table reports group means, standard deviations, and sample sizes. Researchers use these values to understand the direction of differences.
Test of Homogeneity of Variances
Levene’s Test appears here. A non-significant result supports the equal variance assumption.
ANOVA Table
This table determines statistical significance.
Key values include:
- F statistic
- Degrees of freedom
- Significance value
A p-value below .05 indicates a statistically significant difference among group means.
How to Interpret a One Way ANOVA in SPSS
To interpret one way ANOVA SPSS results correctly:
- Check Levene’s Test
- Review the ANOVA table p-value
- Examine group means
- Run multiple comparisons
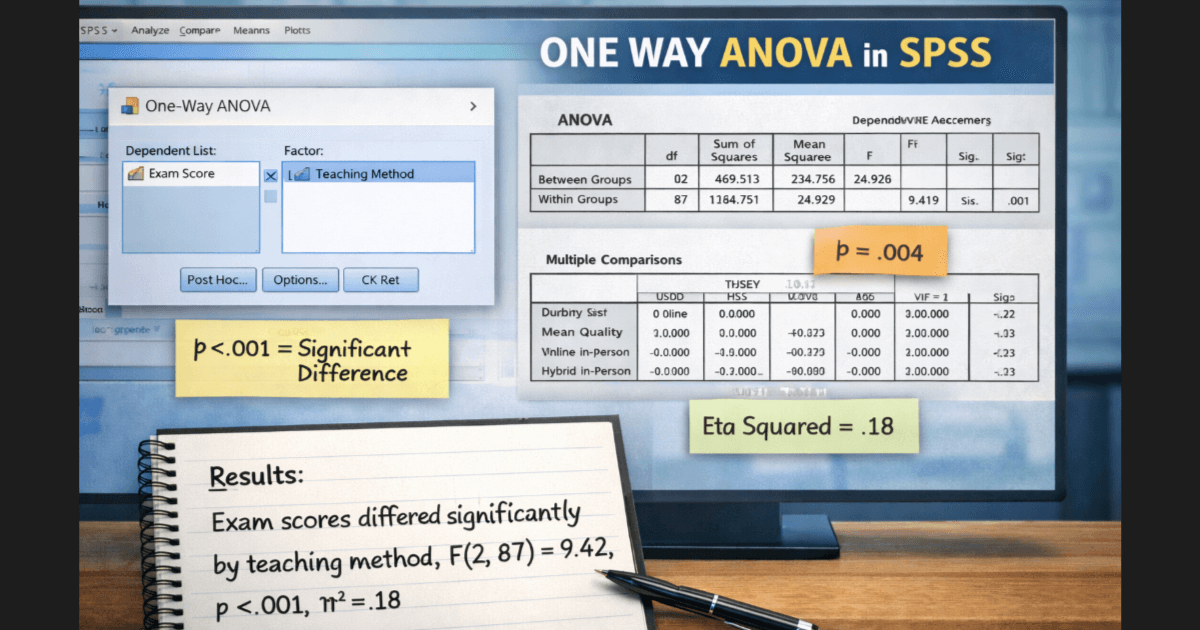
Example interpretation:
A one way ANOVA showed a significant difference in exam scores across teaching methods, F(2, 87) = 9.42, p < .001.
Stuck Interpreting One Way ANOVA Results in SPSS?
Get expert help with factor setup, assumption checks, output interpretation, post hoc tests, and effect size reporting.
✔️Post Hoc Analysis ✔️Effect Size (Eta²) ✔️APA Tables ✔️Homogeneity Checks
Handled by experienced statisticians who follow academic and APA standards.
One Way ANOVA SPSS Multiple Comparisons
A significant ANOVA result does not show which groups differ. Post hoc tests provide that information.
SPSS offers:
- Tukey HSD for equal variances
- Games-Howell for unequal variances
These tests compare each group pair while controlling Type I error.
Effect Size for One Way ANOVA SPSS
Statistical significance alone does not indicate practical importance. Effect size quantifies the magnitude of group differences.
SPSS reports Eta Squared or Partial Eta Squared.
Guidelines:
- 0.01 = small effect
- 0.06 = medium effect
- 0.14 = large effect
Researchers should always report effect size alongside the F statistic.
Calculate Effect Size One Way ANOVA SPSS
SPSS automatically reports effect size when researchers select Estimates of Effect Size in the Options menu. Researchers can also calculate eta squared manually using the ANOVA table sums of squares.
One Way ANOVA SPSS Syntax
Researchers who prefer reproducibility can run one way ANOVA using syntax.
Example:
ONEWAY score BY group
  /STATISTICS DESCRIPTIVES
  /POSTHOC = TUKEY.
Syntax ensures consistent results across analyses.
Common Mistakes in One Way ANOVA SPSS
Researchers often make avoidable errors:
- Ignoring Levene’s Test
- Running multiple t tests instead of ANOVA
- Forgetting post hoc comparisons
- Reporting significance without effect size
Each mistake weakens analytical credibility. If you want expert guidance to avoid these errors and ensure accurate reporting, our SPSS analysis support services can help.
Conclusion
One way ANOVA in SPSS provides a powerful method for comparing multiple group means within a single analysis. When researchers define the factor correctly, follow the proper steps, interpret output tables accurately, and report effect size, the results remain statistically sound and defensible.
Clear execution and correct interpretation determine whether one way ANOVA strengthens or undermines research conclusions.