SPSS data analysis helps students and researchers convert raw data into meaningful statistical results. Many learners collect survey or experimental data but struggle with coding, cleaning, test selection, and interpretation. Errors at any stage can produce misleading conclusions and weak academic reports.
You need a structured workflow to run SPSS correctly. You also need the right statistical tests, correct variable setup, and proper interpretation. Many MSc and PhD students lose marks because they run the wrong tests or report output incorrectly.
This guide explains SPSS data analysis step by step, from data entry to final interpretation. You will also learn when expert support saves time and protects your results.
If you currently struggle with your dataset, you can also get direct academic support through professional SPSS assignment help.
What SPSS Data Analysis Means in Research Practice
SPSS data analysis refers to the process of importing, preparing, testing, and interpreting data using SPSS software. Researchers use SPSS to analyze survey data, experimental data, questionnaire responses, and observational datasets.
SPSS supports:
- Descriptive statistics
- Reliability testing
- Regression models
- Group comparisons
- Factor analysis
- Nonparametric tests
- Survey scale validation
Researchers prefer SPSS because it provides menu-driven statistical procedures and structured output tables. However, software access alone does not guarantee correct analysis. You must align your research questions, variable types, and statistical tests.
Many students run tests without checking assumptions. That mistake leads to invalid conclusions and rejected dissertations.
Professional analysts at MySPSSHelp.com often fix projects where students selected the wrong statistical model from the start.
Step 1: Prepare Your Dataset Correctly
Accurate SPSS data analysis starts with clean data. Poor data structure produces unreliable output.
You should define:
- Variable names
- Variable labels
- Measurement levels
- Value labels
- Missing value rules
Open Variable View in SPSS and configure each variable before entering data. Assign numeric codes for categorical responses. For example:
- Gender: 1 = Male, 2 = Female
- Likert scale: 1 = Strongly disagree to 5 = Strongly agree
Avoid text strings when numeric coding works better. Numeric coding supports faster computation and broader test compatibility.
Check for:
- Out-of-range values
- Duplicate records
- Empty cases
- Data entry errors
Many thesis datasets fail quality checks because students skip this stage.
Step 2: Run Descriptive Statistics First
Descriptive statistics give you a clear summary of your dataset. Always start here before you run advanced tests.
Use:
Analyze → Descriptive Statistics → Frequencies / Descriptives
You should review:
- Means
- Standard deviations
- Minimum and maximum values
- Frequency distributions
This step helps you detect:
- Extreme outliers
- Impossible values
- Skewed distributions
Descriptive results also support your methodology and results chapters. Most academic supervisors expect summary tables before inferential testing.
Step 3: Test Reliability for Survey Scales
If you use multi-item questionnaires, you must test internal consistency. Reliability testing protects your measurement quality.
Run:
Analyze → Scale → Reliability Analysis
Use Cronbach’s Alpha to evaluate consistency.
General interpretation:
- Above 0.9 = Excellent
- 0.8 to 0.9 = Good
- 0.7 to 0.8 = Acceptable
If your alpha value falls too low, review item-total statistics and remove weak items.
You can read a detailed guide here: Reliability Testing in SPSS
Many students skip reliability testing and lose credibility in survey-based research.
Step 4: Choose the Correct Statistical Test
Correct test selection drives valid SPSS data analysis. You must match:
- Research objective
- Variable type
- Number of groups
- Distribution shape
Common choices include:
T-test
Use for comparing two group means.
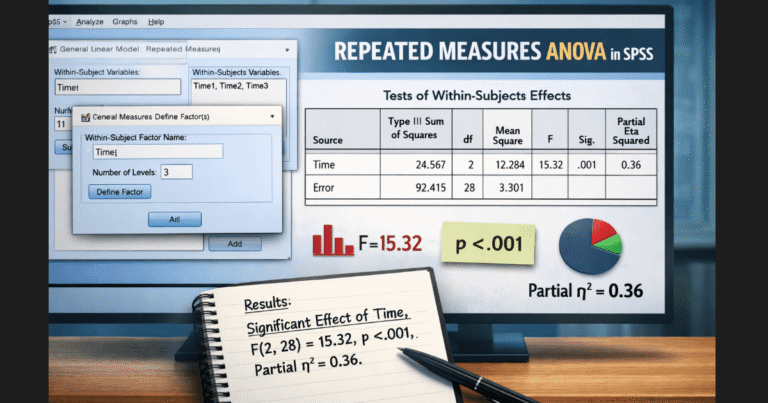
ANOVA
Use for comparing three or more groups.
Chi-square
Use for categorical association testing.
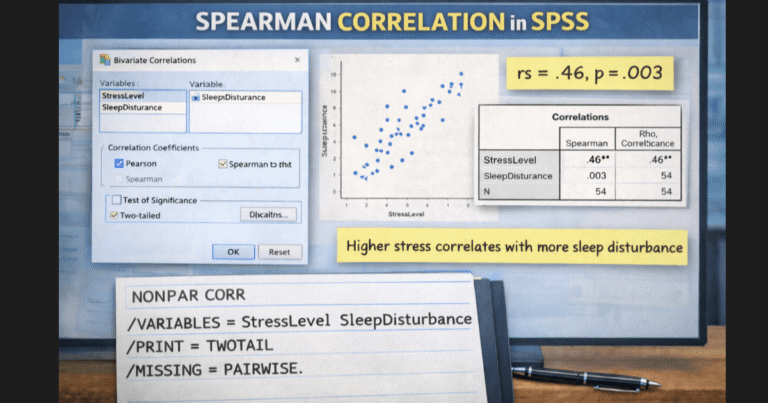
Correlation
Use for relationship strength between numeric variables.
Regression
Use for prediction and effect modeling.
Factor Analysis
Use for scale structure validation.
Students often guess test selection. That approach creates major reporting errors. Expert analysts prevent these mistakes through structured test mapping and hypothesis alignment.
Step 5: Check Statistical Assumptions
Each major test requires assumption checks. You should never skip this stage.
Common assumption checks include:
- Normality tests
- Homogeneity of variance
- Linearity
- Multicollinearity
- Independence
SPSS provides plots and test statistics for each assumption. If assumptions fail, you should switch to nonparametric alternatives.
For example:
- Use Mann–Whitney instead of independent t-test
- Use Kruskal–Wallis instead of ANOVA
Incorrect assumption handling leads to invalid p-values and rejected findings.
Step 6: Interpret SPSS Output Correctly
SPSS produces tables and statistics, but interpretation determines your research quality.
You must explain:
- Test statistic values
- Degrees of freedom
- Significance levels
- Effect sizes
- Confidence intervals
Avoid copying SPSS tables directly into your thesis. Convert output into academic narrative with proper formatting.
Example structure:
- State the test used
- Report the statistic
- Report the p-value
- Explain the decision
- Connect result to hypothesis
Many students request professional help at this stage because interpretation errors reduce marks quickly.
You can also request full analysis and reporting support through SPSS data analysis services.
When You Should Get Expert SPSS Data Analysis Help
You should consider expert help when you face:
- Complex models
- Thesis deadlines
- Supervisor revisions
- Large survey datasets
- Advanced multivariate tests
- Journal submission standards
Expert analysts speed up the workflow and protect result accuracy. They also format outputs correctly for academic chapters and publications.
If you currently feel stuck, use SPSS assignment help support to get guided or fully handled analysis.
Final Thoughts on SPSS Data Analysis
SPSS data analysis requires more than clicking menu options. You need structured data preparation, correct test selection, assumption checks, and accurate interpretation. Each stage affects your final conclusions and academic credibility.
Students who follow a systematic workflow produce stronger research reports and defend results with confidence. Students who rush the process often repeat analysis and miss deadlines.
If your project involves survey data, thesis work, or graded assignments, professional SPSS support can protect your results and save many hours of correction work.