Multivariate linear regression in SPSS is a core statistical method used to examine how multiple independent variables jointly predict a single continuous outcome. In academic and applied research, this technique allows researchers to isolate the unique contribution of each predictor while controlling for others in the model. Because of this, multivariate linear regression is widely used in health sciences, education, psychology, business, and social research.
In this guide, you will learn how to perform multivariate linear regression in SPSS, how to check and meet assumptions, how to interpret SPSS output tables, and how to report results clearly for theses, dissertations, and journal submissions.
What Is Multivariate Linear Regression in SPSS?
Multivariate linear regression estimates the relationship between two or more independent variables and one continuous dependent variable. Each predictor is evaluated while holding all other predictors constant, which makes the model especially useful for controlling confounding effects.
For example, a researcher may examine whether age, income, and education level predict job satisfaction. Similarly, a health study may assess whether sleep quality, stress level, and physical activity jointly predict blood pressure outcomes.
In SPSS, this analysis is conducted using the Linear Regression procedure.
When to Use Multivariate Linear Regression
Multivariate linear regression in SPSS is appropriate when several conditions are met. First, the dependent variable must be continuous. Second, the independent variables may be continuous or categorical (with proper coding). Finally, the research objective should involve explaining or predicting an outcome using multiple predictors simultaneously.
In contrast, if the outcome variable is binary or categorical, logistic regression is more appropriate. Likewise, when repeated measurements exist, alternative models should be considered.
Assumptions of Multivariate Linear Regression in SPSS
Before interpreting results, it is essential to confirm that the model assumptions are satisfied. Violating these assumptions can bias coefficients and weaken conclusions.
Linearity
Each independent variable should have a linear relationship with the dependent variable. Scatterplots and partial regression plots are commonly used to assess this relationship.
Independence of Errors
Residuals should be independent from one another. In SPSS, the Durbin–Watson statistic is used for this purpose, with values close to 2 indicating acceptable independence.
Homoscedasticity
The variance of residuals should remain constant across predicted values. This assumption is typically assessed using standardized residual plots.
Normality of Residuals
Residuals should be approximately normally distributed. Histograms and normal P–P plots provide a visual check of this assumption.
Multicollinearity
Independent variables should not be highly correlated with one another. SPSS reports Tolerance and Variance Inflation Factor (VIF) values to diagnose multicollinearity.
How to Perform Multivariate Linear Regression in SPSS
To ensure accurate results, the regression must be specified correctly.
First, confirm that the dataset contains one continuous dependent variable and multiple independent variables. After that, address missing data and extreme outliers if present.
Next, follow these steps in SPSS:
- Click Analyze
- Select Regression
- Choose Linear
Then, move the outcome variable into the Dependent box. Afterward, place all predictor variables into the Independent(s) box.
Before running the model, click Statistics and select:
- Estimates
- Model fit
- Collinearity diagnostics
- Durbin–Watson
Finally, click OK to run the analysis.
How to Interpret Multivariate Linear Regression SPSS Output
Interpreting SPSS output requires examining several tables in sequence rather than focusing on a single value.
Model Summary Table
The Model Summary table shows R square and Adjusted R square, which indicate how much variance the predictors explain in the dependent variable. Researchers typically report adjusted R square because it accounts for the number of predictors in the model.
In addition, the table reports the Durbin–Watson statistic, which researchers use to assess the independence of errors.
ANOVA Table
The ANOVA table evaluates whether the overall regression model is statistically significant. A significant p-value indicates that the predictors collectively explain a meaningful proportion of variance in the outcome.
Coefficients Table
The Coefficients table is the most important output for interpretation.
Here, the Unstandardized B values represent the expected change in the dependent variable for a one-unit increase in the predictor, holding other variables constant. Meanwhile, Standardized Beta coefficients allow comparison of the relative importance of predictors measured on different scales.
At the same time, the Sig. column identifies which predictors are statistically significant. Finally, VIF and tolerance values are reviewed to confirm that multicollinearity is not a concern.
Example of Multivariate Linear Regression Interpretation
A clear interpretation combines statistical values with substantive meaning.
A multivariate linear regression model significantly predicted job satisfaction, F(3, 96) = 18.42, p < .001, explaining 36% of the variance (Adjusted R² = .34). Income (β = .41, p < .001) and work-life balance (β = .29, p = .004) were significant predictors, whereas age was not statistically significant (p = .12).
This format is suitable for theses, dissertations, and peer-reviewed articles.
Multicollinearity in Multivariate Linear Regression SPSS
Multicollinearity occurs when predictors are strongly correlated. This can inflate standard errors and destabilize coefficients.
As a guideline:
- VIF values above 10 indicate serious multicollinearity
- VIF values between 5 and 10 suggest moderate concern
- Tolerance values below 0.10 signal potential problems
When multicollinearity is present, researchers may remove predictors, combine variables, or reconsider model structure.
Reporting Multivariate Linear Regression Results – APA Style
When reporting results, clarity and completeness are essential. A proper report includes model significance, variance explained, individual coefficients, and assumption checks.
For example:
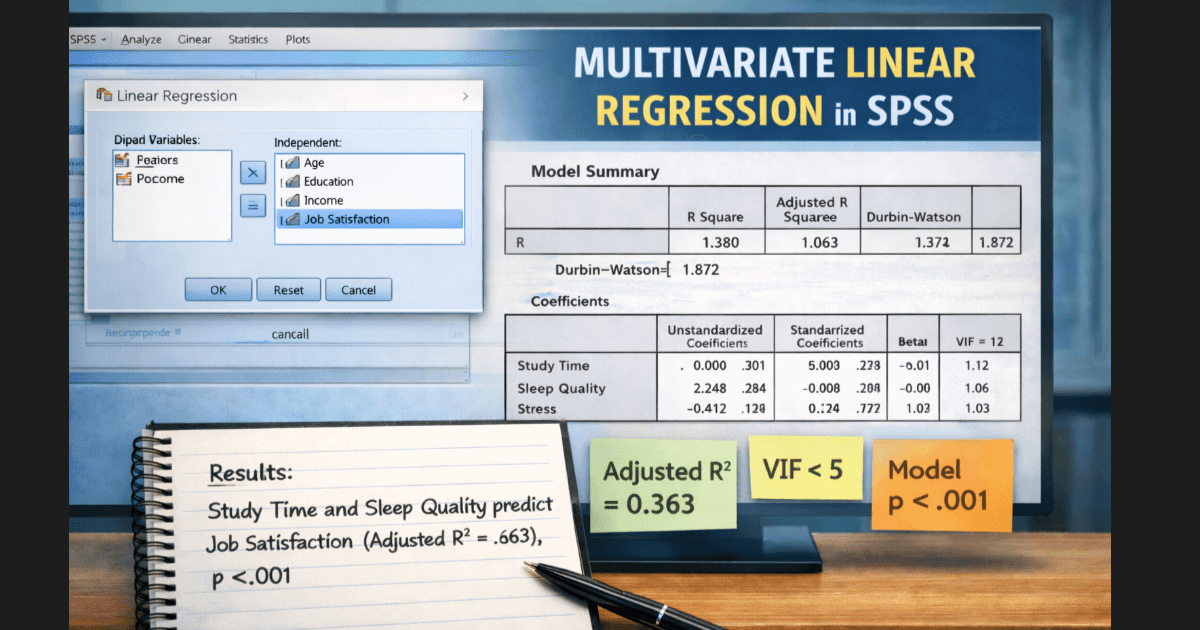
A multivariate linear regression analysis showed that the model was significant, F(4, 120) = 22.67, p < .001, explaining 43% of the variance in academic performance (Adjusted R² = .41). Study time and sleep quality were significant predictors, while stress level was not.
Common Mistakes to Avoid
Several recurring errors weaken regression analysis. These include ignoring multicollinearity diagnostics, overinterpreting R values, failing to report adjusted R square, and overlooking assumption violations. In many cases, these mistakes lead to thesis revisions or reviewer criticism.
Is Expert SPSS Support Needed?
As models grow more complex, interpretation becomes more demanding. Interaction terms, assumption violations, or large predictor sets often require advanced handling. In such cases, professional SPSS dissertation help ensures correct model specification, accurate interpretation, and APA-compliant reporting.
Conclusion
Multivariate linear regression in SPSS is a powerful method for understanding how multiple predictors influence an outcome variable. By carefully checking assumptions, performing the analysis correctly, and interpreting output systematically, researchers can produce reliable and defensible results.
Ultimately, precision in execution and clarity in interpretation determine the quality of regression-based research.