Spearman correlation in SPSS measures the strength and direction of a monotonic relationship between two variables. Researchers typically use this nonparametric correlation when data violate normality assumptions, include ordinal measurements, or contain outliers that distort Pearson correlation results.
This guide explains how to run and interpret output tables, how to create scatter plots, how to report results correctly, and how to conduct partial Spearman correlation in SPSS for controlled analysis.
What Is Spearman Correlation in SPSS?
Spearman’s rank-order correlation coefficient (ρ or rs) evaluates how well the relationship between two variables follows a monotonic pattern. Instead of relying on raw values, Spearman correlation uses ranked data, which makes it robust against non-normal distributions and extreme values.
Researchers commonly apply Spearman correlation when:
- Variables are ordinal
- Data violate normality
- Relationships are monotonic but not linear
- Outliers influence Pearson correlation
When to Use Spearman Correlation in SPSS
Researchers should use Spearman when:
- Variables follow ordinal measurement scales
- Continuous variables violate normality assumptions
- Data include influential outliers
- The relationship changes consistently in one direction
If data meet parametric assumptions and show linear relationships, Pearson correlation remains more appropriate.
How to Run Spearman Correlation in SPSS
To run Spearman correlation correctly, follow these steps.
- Click Analyze
- Select Correlate
- Choose Bivariate
Next, move the variables of interest into the Variables box.
Then:
- Select Spearman
- Deselect Pearson if necessary
- Choose Two-tailed significance (unless theory dictates otherwise)
Finally, click OK to generate the output.
Spearman Correlation Output Explained
Understanding output tables ensures correct interpretation.
Correlations Table
SPSS reports:
- Spearman correlation coefficient (rs)
- Significance value (p-value)
- Sample size (N)
The coefficient ranges from −1 to +1. Values closer to ±1 indicate stronger monotonic relationships.
How to Interpret Spearman Correlation SPSS Results
Correct Spearman correlation SPSS interpretation follows a structured approach.
- Identify the sign of the coefficient
- Evaluate the strength of the relationship
- Check the p-value for statistical significance
- Interpret direction and magnitude together
General guidelines:
- 0.00–0.19: very weak
- 0.20–0.39: weak
- 0.40–0.59: moderate
- 0.60–0.79: strong
- 0.80–1.00: very strong
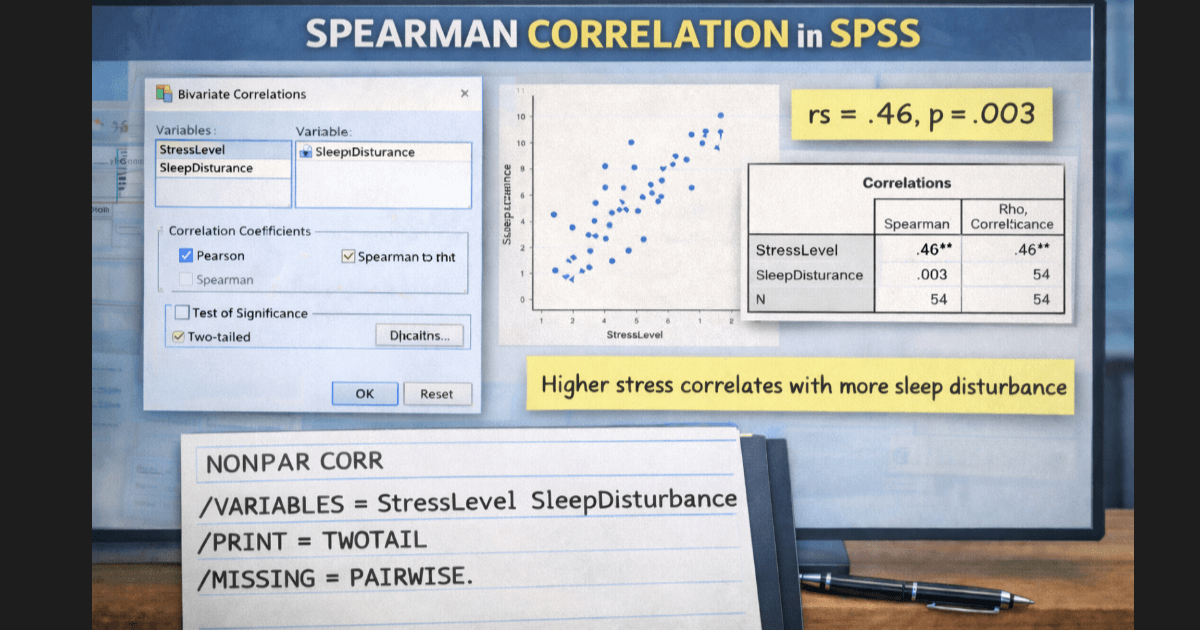
Example interpretation:
Spearman correlation analysis showed a moderate positive association between stress level and sleep disturbance, rs = .46, p = .003.
Interpreting The Output Correctly
Statistical significance does not imply practical importance. Researchers should always interpret the coefficient size and direction, not the p-value alone.
For example, a small coefficient with a significant p-value may reflect large sample size rather than meaningful association.
Scatter Plot for Spearman Correlation SPSS
Although Spearman correlation does not assume linearity, scatter plots still help visualize monotonic trends.
To create a scatter plot:
- Click Graphs
- Select Chart Builder
- Choose Scatter/Dot
- Assign variables to X and Y axes
A consistent upward or downward pattern supports Spearman correlation assumptions.
Partial Spearman Correlation SPSS Syntax
Partial Spearman allows researchers to control for a third variable while assessing the relationship between two ranked variables.
This analysis helps isolate relationships that may appear due to confounding factors. SPSS does not offer partial Spearman correlation through menus. Researchers must use syntax.
Example:
NONPAR CORR
  /VARIABLES = var1 var2 var3
  /PRINT = TWOTAIL
  /MISSING = PAIRWISE
  /PARTIAL = var3.
This syntax computes the Spearman correlation between var1 and var2 while controlling for var3.
Spearman Correlation SPSS Syntax
Researchers who prefer reproducible analysis can use the following syntax.
Basic Spearman Correlation Syntax
NONPAR CORR
  /VARIABLES = var1 var2
  /PRINT = TWOTAIL
  /MISSING = PAIRWISE.
Replace var1 and var2 with actual variable names.
How to Report Spearman Correlation SPSS Results
APA-style reporting requires:
- Correlation type
- Correlation coefficient
- Sample size
- Significance level
Example:
Spearman’s rank-order correlation indicated a significant positive association between motivation and academic engagement, rs(52) = .48, p = .001.
Common Mistakes
Researchers often commit avoidable errors:
- Using Spearman correlation without checking monotonicity
- Reporting Pearson instead of Spearman coefficients
- Interpreting correlation as causation
- Ignoring scatter plots
Each mistake weakens analytical credibility.
Conclusion
Spearman provides a reliable method for analyzing monotonic relationships when data violate parametric assumptions. By running the test correctly, interpreting coefficients carefully, visualizing trends with scatter plots, and reporting results clearly, researchers strengthen the validity of their findings.