Descriptive analysis in SPSS plays a central role in quantitative research. Researchers rely on it to understand datasets before applying complex statistical models. When used correctly, descriptive analysis provides clarity about data distribution, central tendency, variability, and overall patterns. These insights guide decisions about further analysis and help prevent incorrect conclusions.
In SPSS, descriptive analysis offers structured tools that summarize numerical and categorical data efficiently. Researchers in health sciences, psychology, education, and business use these tools to describe samples, check assumptions, and present results clearly. Without descriptive analysis, inferential statistics lack context and meaning.
This article explains descriptive analysis in SPSS in detail. It covers the meaning, definition, techniques, tools, and real examples. It also explains how to interpret descriptive analysis for quantitative data and research reporting. Each section aligns with academic standards and practical SPSS workflows, ensuring clarity for both beginners and advanced users.
What Is Descriptive Analysis? Meaning and Definition
Researchers often ask, what is descriptive analysis and why does it matter. Descriptive analysis refers to statistical methods that summarize and organize data in a meaningful way. It focuses on describing what the data shows rather than explaining why patterns occur. This distinction separates descriptive analysis from inferential statistics.
The descriptive analysis definition emphasizes simplicity and clarity. It involves measures such as mean, median, mode, standard deviation, range, frequency, and percentages. These measures help researchers understand the basic structure of a dataset. For example, they show where most values cluster and how much variation exists among observations.
The descriptive analysis meaning extends beyond numbers. It includes tables, charts, and graphical summaries that make data easier to interpret. In research contexts, descriptive analysis helps scholars describe participant characteristics, response patterns, and outcome distributions. These summaries often appear in the results section of theses, dissertations, and journal articles.
Many researchers also ask, what is a descriptive analysis in practical terms. It serves as the first analytical step after data cleaning. It answers questions such as how old participants are, how responses spread across categories, and whether extreme values exist. In SPSS, descriptive analysis tools automate these tasks, which reduces errors and saves time. This foundation ensures that later analyses rely on accurate and well understood data.
How to Run Descriptive Statistics in SPSS (Step-by-Step)
Running descriptive analysis in SPSS follows a simple and structured process. These steps apply to most quantitative research datasets and ensure accurate statistical summaries.
First, open your dataset in SPSS. Ensure that variables use correct measurement levels. Set categorical variables as nominal and numerical variables as scale. Proper variable setup prevents incorrect output.
Next, click Analyze from the top menu. Select Descriptive Statistics, then choose Descriptives. A dialog box opens showing all available variables. Move the quantitative variables you want to summarize into the Variables box.
Click the Options button to customize output. Select statistics such as mean, standard deviation, minimum, maximum, and variance. These measures support most research reporting requirements. Click Continue, then click OK to generate the output.
For categorical variables, return to Analyze, then Descriptive Statistics, and select Frequencies. Move the categorical variables into the analysis box. Choose whether to display frequency tables and charts. Click OK to view counts and percentages.
SPSS displays results in the Output Viewer. Each table presents descriptive statistics clearly and consistently. Researchers typically export these tables to Word or Excel for formatting according to APA guidelines.
How to Interpret Descriptive Analysis Results
Researchers often ask how to interpret descriptive analysis correctly. Interpretation requires linking statistical summaries to research context while avoiding overgeneralization. Descriptive statistics describe the sample, not the population.
Start interpretation by examining central tendency. The mean shows the average value, while the median shows the midpoint. Large differences between mean and median suggest skewness. Next, examine dispersion. A large standard deviation indicates wide variability, while a small one indicates consistency.
For categorical variables, interpretation focuses on frequencies and percentages. The most frequent category represents the dominant response. Researchers should describe these patterns clearly in text and tables.
In SPSS output, interpretation also includes checking minimum and maximum values. These values help identify potential data entry errors or extreme observations. Visual tools such as histograms support interpretation by revealing distribution shapes.
Descriptive analysis interpretation should remain neutral and factual. Researchers should avoid causal language and theoretical explanations at this stage. Clear interpretation strengthens the credibility of later analyses and improves overall research quality.
Descriptive Analysis in Research and Quantitative Data
Descriptive analysis in research supports evidence based conclusions by presenting data transparently. It allows readers to understand the sample and variables before evaluating hypotheses. In quantitative research, descriptive analysis for quantitative data plays an essential role in data validation and reporting.
Researchers use descriptive analysis to summarize continuous variables such as age, income, test scores, and clinical measures. They also use it for categorical variables such as gender, education level, or diagnostic group. Frequencies and percentages describe categories clearly, while means and standard deviations describe numerical variables accurately.
Quantitative descriptive analysis also helps researchers detect data issues early. Skewed distributions, outliers, or unusual patterns become visible through descriptive statistics. These insights guide decisions about data transformation, exclusion criteria, or choice of statistical tests. For example, a heavily skewed variable may require nonparametric methods later.
In applied research, descriptive analysis strengthens credibility. Reviewers and readers expect clear summaries of sample characteristics. Journals often require descriptive tables that present means, standard deviations, and ranges. SPSS simplifies this process by producing clean output tables that researchers can adapt for publication.
Descriptive analysis in research also supports replication. When researchers describe their data clearly, others can evaluate study quality and repeat analyses accurately. This transparency supports scientific rigor and ethical reporting. For these reasons, descriptive analysis remains a non negotiable step in quantitative research workflows.
Descriptive Analysis Techniques and Tools in SPSS
Descriptive analysis techniques vary based on data type and research goals. SPSS provides a structured set of tools that support these techniques efficiently. Understanding these tools helps researchers select the correct approach for each variable.
Common descriptive analysis techniques include measures of central tendency, measures of dispersion, and frequency analysis. Central tendency includes mean, median, and mode. Dispersion includes standard deviation, variance, range, minimum, and maximum. Frequency analysis summarizes categorical responses using counts and percentages.
SPSS groups these techniques into accessible menu options. The Descriptive Statistics menu allows users to compute means, standard deviations, and ranges quickly. The Frequencies function supports categorical data and produces tables and charts. The Explore function adds deeper insights by including boxplots, normality checks, and group comparisons.
Descriptive analysis tools in SPSS also support visualization. Histograms, bar charts, and pie charts help researchers communicate findings clearly. Visual tools complement numerical summaries and improve interpretation, especially for non technical audiences.
Researchers benefit from SPSS because it enforces consistency. Each descriptive output follows a standardized format, which reduces reporting errors. These tools also allow customization, such as selecting specific statistics or grouping variables. When researchers understand descriptive analysis techniques in SPSS, they gain control over data presentation and interpretation.
Descriptive Analysis Examples Using SPSS
Descriptive analysis examples help clarify how theory translates into practice. Below is a sample table representing descriptive analysis results for quantitative variables commonly reported in research.
Table 1
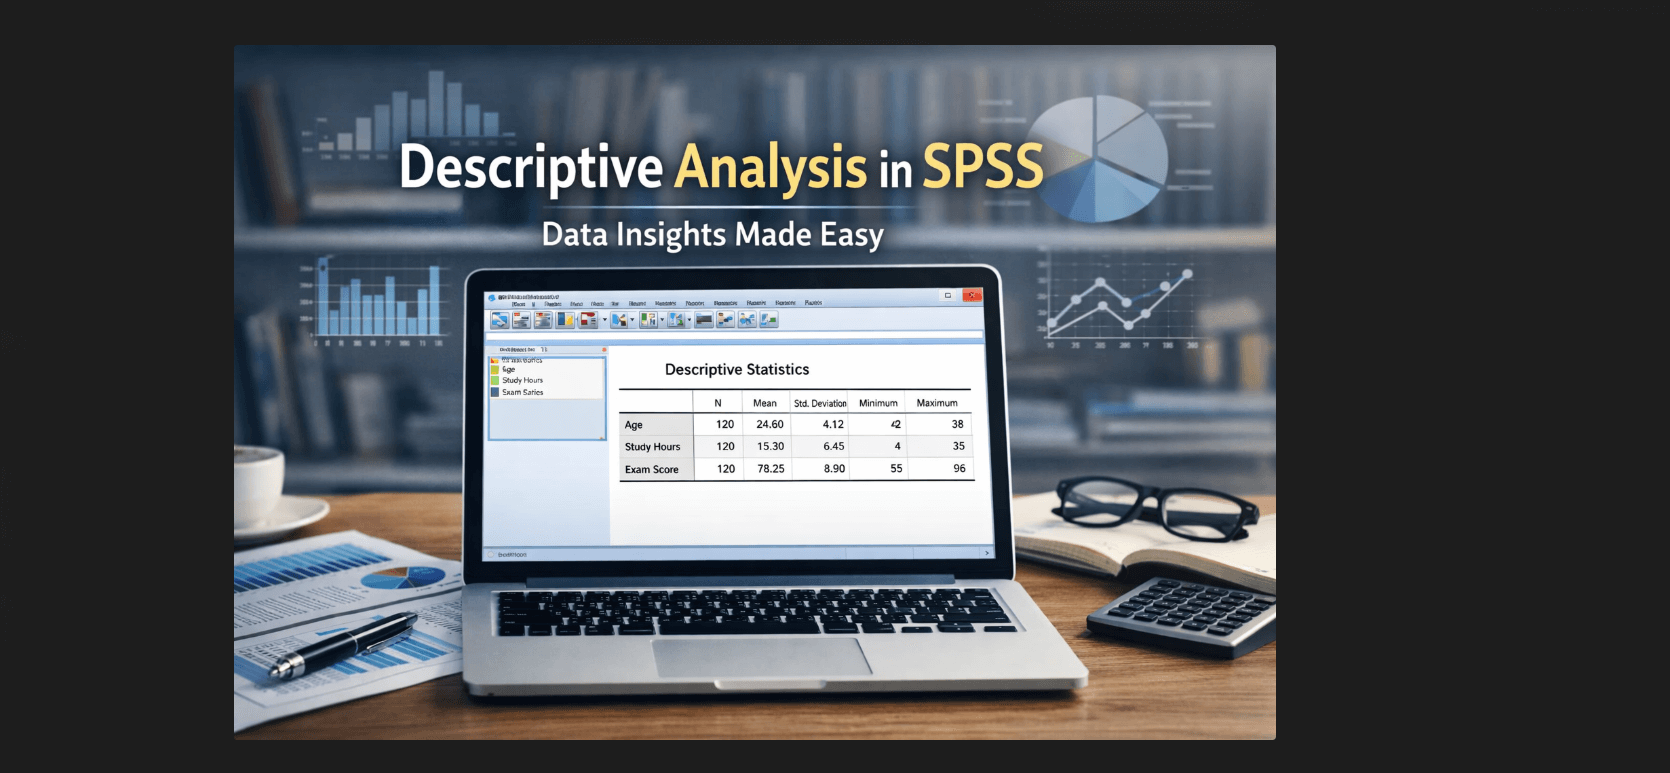
Descriptive Statistics for Study Variables (N = 120)
| Variable | Mean | SD | Minimum | Maximum |
|---|---|---|---|---|
| Age (years) | 24.60 | 4.12 | 18 | 38 |
| Study Hours / Week | 15.30 | 6.45 | 4 | 35 |
| Exam Score (%) | 78.25 | 8.90 | 55 | 96 |
Interpretation of Descriptive Analysis Results
The descriptive statistics provide a clear summary of the sample characteristics. The mean age of participants was 24.60 years, with a standard deviation of 4.12. This result indicates moderate variability in participant age. Most participants fell within early adulthood.
Participants reported an average of 15.30 study hours per week. The relatively large standard deviation of 6.45 suggests notable differences in study habits across individuals. Some participants studied minimally, while others devoted substantial time to preparation.
The mean exam score was 78.25 percent, with a standard deviation of 8.90. Scores ranged from 55 to 96 percent. This spread shows sufficient variability to support further inferential analysis. No extreme ceiling or floor effects appeared in the data.
Overall, the descriptive analysis confirms that the dataset contains adequate variability and no obvious anomalies. These findings support the suitability of the data for subsequent statistical testing.
APA Style Reporting of Descriptive Statistics
When reporting descriptive analysis in APA style, researchers should present statistics concisely and consistently. Values should appear in text with appropriate notation and units.
Example APA-style narrative reporting:
Participants had a mean age of 24.60 years (SD = 4.12). They reported studying an average of 15.30 hours per week (SD = 6.45). The mean exam score was 78.25% (SD = 8.90).
Tables should follow APA formatting guidelines. Include a table number, italicized title, and clear column labels. Avoid excessive decimal places and ensure consistency across variables.
Why Descriptive Analysis in SPSS Matters
Descriptive statistical analysis in SPSS forms the backbone of quantitative research. It provides structured, reliable summaries that help researchers understand their data fully. Without this step, advanced statistical testing lacks context and clarity.
Researchers who master descriptive analysis gain confidence in their data. They detect issues early, report results transparently, and communicate findings effectively. SPSS supports this process by offering consistent and powerful descriptive tools tailored for research needs.