Simple linear regression in SPSS is a statistical method used to examine the relationship between one independent variable (predictor) and one continuous dependent variable (outcome). The goal is to determine whether changes in the predictor are associated with changes in the outcome, and to estimate how strong that relationship is.
For example, a researcher may want to know whether:
- Hours of sleep predict concentration levels
- Calories consumed predict weight change
- Training time predicts athletic performance
In each case, there is one predictor and one outcome, making simple linear regression the appropriate method.
SPSS provides a straightforward way to run this analysis and produce statistical output. However, knowing how to run simple linear regression in SPSS and how to interpret the results correctly is essential to ensure accurate conclusions. This guide explains what the method is, when it should be used, how to perform the analysis, how to report the results in APA format, and the key assumptions you must check.
When Is Simple Linear Regression in SPSS Appropriate?
Simple linear regression in SPSS is appropriate when your research question focuses on predicting or explaining one continuous dependent variable from a single independent variable.
It is suitable when:
- You have one predictor variable
- The dependent variable is continuous (e.g., score, time, income, level)
- You expect a linear relationship
- Your goal is prediction or explanation
- The sample size is reasonable
- Regression assumptions can be tested
Examples of appropriate use
- When predicting job satisfaction score from years of experience.
- Predicting reaction time from caffeine intake.
- When predicting sales revenue from advertising spend.
- Predicting running speed from training distance.
In each example, there is one predictor and one continuous outcome, which matches the purpose of simple linear regression.
When Is Simple Linear Regression in SPSS NOT Appropriate?
Simple linear regression is not appropriate if your research design or data do not fit the method.
It should NOT be used when:
- The dependent variable is categorical (e.g., employed vs unemployed, pass vs fail)
- You have more than one predictor (use multiple linear regression instead)
- The relationship is clearly non-linear (for example, curved rather than straight-line)
- The sample size is extremely small (leading to unstable results)
- Outliers strongly influence the relationship
- Regression assumptions are severely violated
Examples of incorrect use
- Predicting disease presence (yes/no) from blood pressure. Logistic regression would be required.
- When predicting exam score from both study hours and attendance. Multiple regression is appropriate.
It is also important to remember that regression analysis does not prove causation. This is however not the case if the data come from a well-controlled experimental design.
How to Run Simple Linear Regression in SPSS
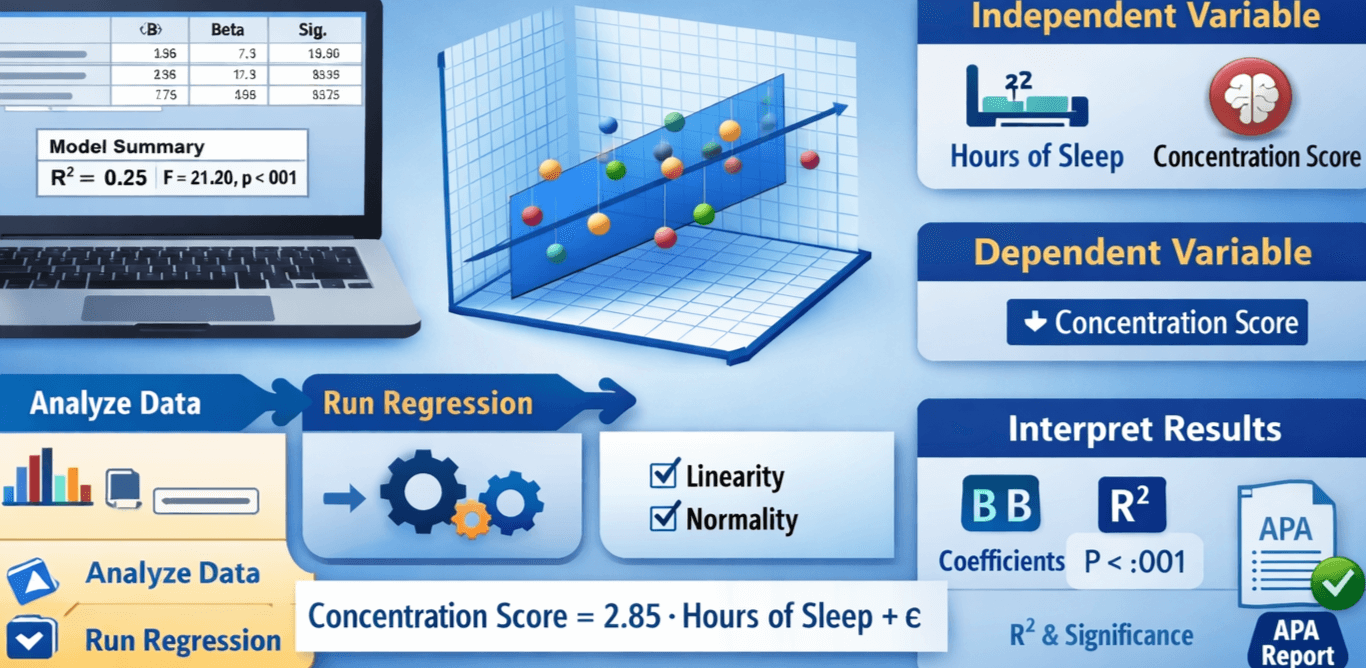
Assume we want to predict Concentration Score (dependent variable) from Hours of Sleep (independent variable).
Step-by-Step Procedure
- Open your dataset in SPSS
- Click Analyze in the top menu
- Select Regression → Linear…
- Move your dependent variable (e.g., Concentration Score) into the Dependent box.
- Move your independent variable (e.g., Hours of Sleep) into the Independent(s) box
- Click Statistics and select:
• Estimates
• Model fit
• Confidence intervals - Click Continue
- Click OK
SPSS generates several output tables, including:
• Model Summary
• ANOVA table
• Coefficients table
APA-Style SPSS Output Example
Below is an example of how simple linear regression results may appear in APA-style table format.
Table 1
Simple Linear Regression Predicting Concentration from Hours of Sleep
| Predictor | B | SE B | Beta | t | p |
|---|---|---|---|---|---|
| Hours of Sleep | 2.85 | 0.62 | .50 | 4.60 | <.001 |
Note. R² = .25, F(1,118) = 21.20, p < .001.
Simple Linear Regression SPSS Interpretation
Here is an example of how to interpret simple linear regression SPSS results clearly and academically:
A simple linear regression was conducted to determine whether hours of sleep predicted concentration performance. The regression model was statistically significant, F(1,118) = 21.20, p < .001, explaining 25% of the variance in concentration scores (R² = .25).
Hours of sleep were a significant positive predictor of concentration (B = 2.85, p < .001). This means that for each additional hour of sleep, concentration score increased by an estimated 2.85 points.
These results suggest that individuals who sleep longer tend to perform better on concentration tasks.
Assumptions of Simple Linear Regression in SPSS
To ensure valid results, the following assumptions must be assessed:
1. Linearity
The relationship between predictor and outcome must be linear.
Checked using a scatterplot.
2. Independence of Errors
Residuals should be independent.
Often assessed using the Durbin-Watson statistic.
3. Homoscedasticity
Residuals should have constant variance across all predictor values.
Checked using residual plots.
4. Normality of Residuals
Residuals should be approximately normally distributed.
Checked using histograms or Q-Q plots.
5. No Extreme Outliers
Severe outliers may distort results.
Checked using standardized residuals.
Common Mistakes to Avoid
Researchers often make the following errors:
- Using regression when the dependent variable is not continuous
- Ignoring influential outliers
- Reporting only p-values without effect size
- Misinterpreting the direction of relationships
- Assuming correlation equals causation
- Failing to check assumptions
- Using very small samples