Multiple regression in SPSS helps researchers and analysts examine how several independent variables together predict one continuous dependent variable. Unlike simple linear regression, this method allows you to assess the unique contribution of each predictor while controlling for the others. Therefore, it becomes extremely powerful for real-world research.
Imagine you want to understand what predicts employee productivity. You might include education level, weekly training hours, and job satisfaction as predictors. Multiple regression shows how each one relates to productivity while adjusting for the influence of the others.
This guide explains how to run multiple regression in SPSS, how to interpret multiple regression results in SPSS, assumptions of multiple regression in SPSS, and more advanced topics including forced entry, testing normality, unique variance, non parametric multiple regression in SPSS, and simultaneous multiple regression in SPSS.
When Should You Use Multiple Regression in SPSS?
Use multiple regression when:
• You have one continuous dependent variable
• Two or more independent variables predict it
• The relationships are expected to be linear
• You want to understand joint and unique effects
For example:
A health researcher might want to know whether exercise frequency, calorie intake, and stress level predict blood glucose level.
That situation fits perfectly.
However, do not use this method when your dependent variable is categorical. Logistic regression works better in that case.
How to Run Multiple Regression in SPSS
Here’s a simple scenario:
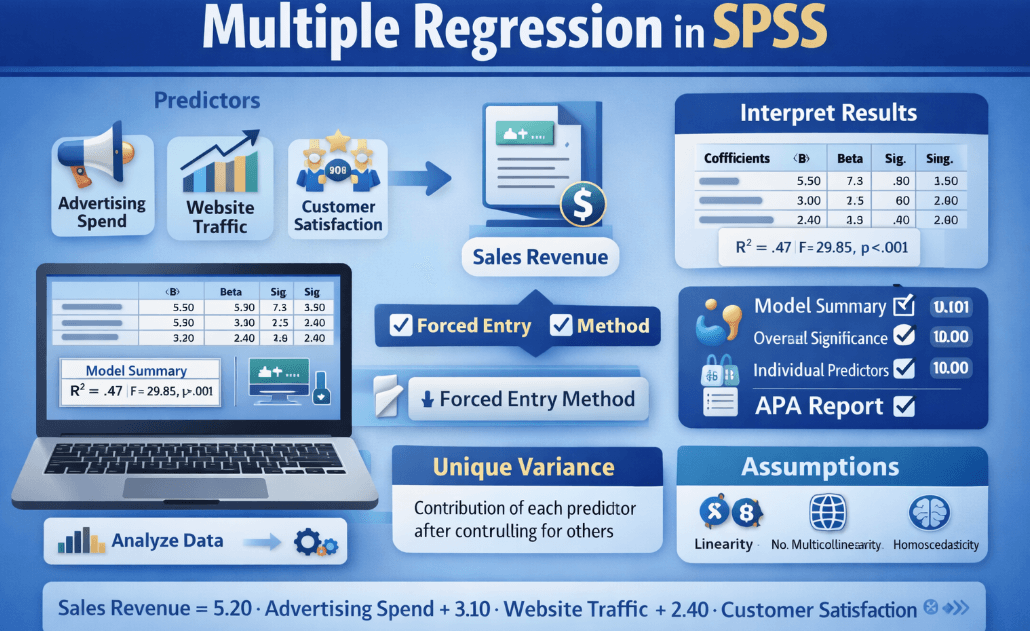
You want to predict monthly sales revenue from advertising spend, website traffic, and customer satisfaction score.
Follow these steps:
- Open your dataset in SPSS
- Click Analyze
- Select Regression → Linear…
- Move Sales Revenue to the Dependent box
- Move Advertising Spend, Website Traffic, Customer Satisfaction to Independent(s)
- Click Statistics and choose:
• Estimates
• Model Fit
• Confidence Intervals - Click Continue
- Press OK
You now have your output.
How to Interpret Multiple Regression Results in SPSS
Look at these key tables first:
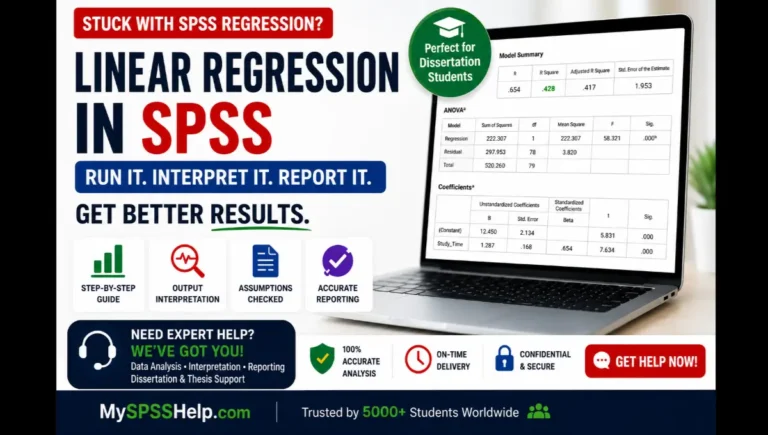
1. Model Summary
This shows R and R-square.
R-square tells you how much variance in the dependent variable the model explains.
For example:
R² = .47 means the predictors explain 47% of the variation in sales revenue.
2. ANOVA Table
This tells you whether the model is statistically significant overall.
3. Coefficients Table
This matters the most.
You will see:
• Unstandardized B values
• Standardized Beta values
• t-tests
• p-values
If Advertising Spend has:
B = 5.2, p < .01
Then each additional advertising dollar predicts a 5.2-unit increase in revenue, holding other predictors constant.
Meanwhile, if Website Traffic has:
B = 3.1, p < .05
Then traffic still predicts sales beyond advertising.
Finally, Customer Satisfaction might show:
B = 2.4, p > .05
That means satisfaction does not significantly predict sales once other predictors enter the model.
This is where unique variance multiple regression SPSS becomes important.
Need Help With SPSS Regression? We have You Covered
From running the analysis to interpreting results and APA-style reporting, we provide professional support for multiple and simple regression in SPSS. Perfect for dissertations, theses, assignments, and research projects.
✔ Dissertations ✔Thesis ✔Assignments ✔Research Projects
Unique Variance in Multiple Regression SPSS
Unique variance refers to the portion of the dependent variable explained ONLY by one predictor after controlling for others.
In SPSS, standardized Beta coefficients and semi-partial correlations help you judge this contribution.
So, even if two predictors correlate strongly with the dependent variable, only one might show unique predictive value.
Simultaneous Multiple Regression in SPSS
Simultaneous multiple regression means you enter all predictors into the model at the same time.
SPSS uses this method by default.
Researchers use simultaneous multiple regression in SPSS when theory does not suggest entering predictors in stages.
Forced Entry Multiple Regression in SPSS
Forced entry multiple regression in SPSS simply means all predictors enter together intentionally rather than stepwise or hierarchical order**.
You choose this method when:
• You already know which predictors belong in the model
• You want objective comparison
• You want to avoid automatic selection bias
SPSS calls this Enter Method.
Assumptions
You must satisfy these assumptions:
- Linearity
- Independence of errors
- Homoscedasticity
- Normality of residuals
- No multicollinearity
- Continuous dependent variable
Now let’s examine one key assumption in detail.
Test Normality Multiple Regression SPSS
Normality refers to the distribution of residuals, not the raw variables.
In SPSS:
- Save Standardized Residuals
- View Histogram
- Inspect Normal Probability Plot
If the curve appears roughly bell-shaped, you are fine.
You do not need perfect normality.
Non Parametric Multiple Regression SPSS
Sometimes data violate assumptions badly, even after transformation. In that situation, you might consider non parametric multiple regression in SPSS alternatives such as:
• Generalized Linear Models
• Quantile Regression
• Robust Regression
APA-Style Example
A multiple regression examined whether advertising spend, website traffic, and customer satisfaction predicted monthly sales revenue. The overall model significantly predicted revenue, F(3,142) = 29.85, p < .001, explaining 47% of the variance (R² = .47).
Advertising spend significantly predicted revenue (B = 5.20, p < .01), as did website traffic (B = 3.10, p = .02). Customer satisfaction did not significantly predict revenue (B = 2.40, p = .09).
Common Mistakes to Avoid
Researchers often run into problems when they:
• Ignore multicollinearity
• Use too many predictors for small samples
• Fail to interpret unique variance
• Treat correlation as causation
• Skip assumption testing