Researchers frequently need to compare the means of two distinct groups to determine whether a statistically significant difference exists between them. The independent samples t-test in SPSS serves this exact purpose and remains one of the most widely used inferential statistical techniques across social sciences, business, healthcare, psychology, and education research. When applied correctly, it provides a reliable method for evaluating group differences while maintaining statistical rigor.
This article explains what an independent samples t-test is, when to use it, how to perform an independent samples t-test in SPSS, how to interpret the output, key assumptions, and SPSS syntax. The guide emphasizes correct decision-making, output interpretation, and academic reporting to help you avoid common analytical errors.
By the end of this guide, you will understand how to confidently run and interpret an independent samples t-test in SPSS for real-world research scenarios.
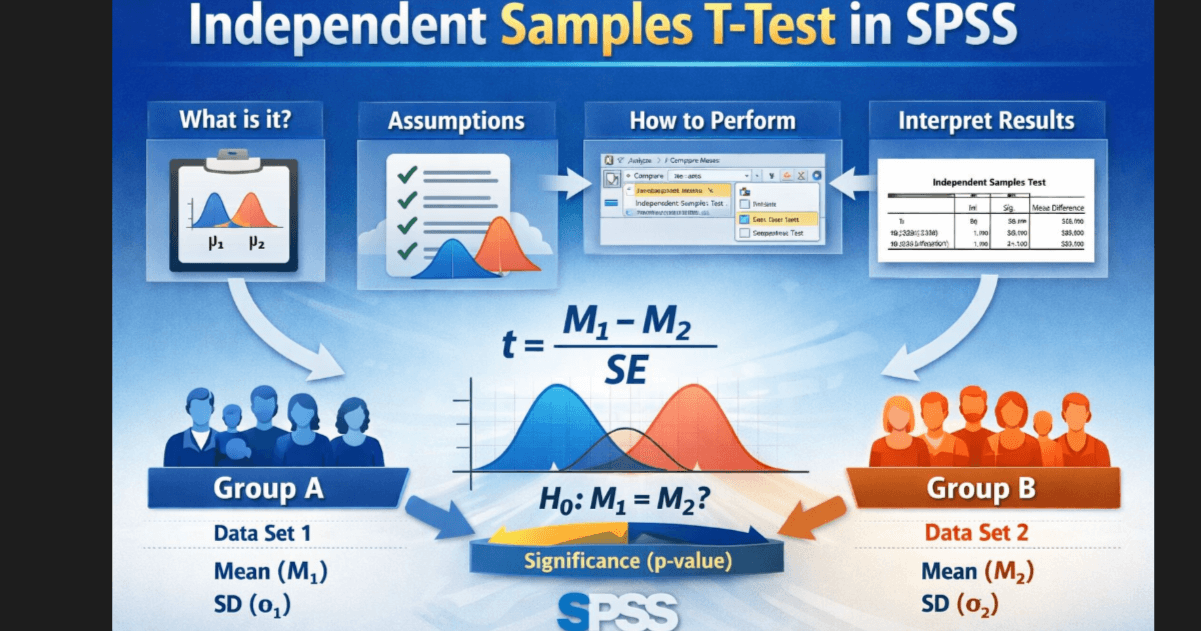
What Is an Independent Samples T-Test?
An independent samples t-test compares the means of two unrelated or independent groups to determine whether the observed difference between them reflects a true population difference or random sampling variation.
Each participant belongs to only one group, and no participant appears in both groups. For example:
- Male vs female respondents
- Treatment group vs control group
- Online learners vs classroom learners
The test evaluates whether the difference between group means reaches statistical significance based on the variability within groups and sample size.
Mathematically, the independent samples t-test evaluates:
- Mean difference between Group 1 and Group 2
- Standard error of the difference
- Probability value (p-value) associated with the t-statistic
SPSS automates these calculations while providing a structured output that supports decision-making.
When to Use an Independent Samples T-Test in SPSS
You should use an independent samples t-test in SPSS when your research design meets the following criteria:
- You want to compare the means of two independent groups
- Your dependent variable is continuous (interval or ratio scale)
- Your independent variable is categorical with exactly two groups
- You aim to test whether the mean difference is statistically significant
Common Research Scenarios
- Comparing average test scores between two teaching methods
- Examining income differences between two regions
- Evaluating pre-intervention and control group differences
- Assessing satisfaction levels between two customer segments
If your study involves more than two groups, ANOVA provides a more appropriate analytical approach.
Assumptions of Independent Samples T-Test in SPSS
Before running the test, you must verify that your data meets the assumptions of the independent samples t-test. Violating these assumptions can compromise result validity.
1. Independence of Observations
Each participant must belong to only one group, and observations must remain unrelated. Study design determines this assumption, not SPSS.
2. Continuous Dependent Variable
The dependent variable must use an interval or ratio scale. Examples include scores, time, income, or measurements.
3. Normality
Each group should approximate a normal distribution. SPSS allows you to assess normality using:
- Shapiro-Wilk test
- Histograms
- Q-Q plots
Moderate deviations from normality rarely invalidate results when sample sizes exceed 30 per group.
4. Homogeneity of Variance
Group variances should remain approximately equal. SPSS tests this assumption using Levene’s Test for Equality of Variances.
If Levene’s Test reaches significance, SPSS automatically provides an alternative t-test result that adjusts for unequal variances.
How to Perform an Independent Samples T-Test in SPSS
Follow these steps carefully to run the test correctly.
Step 1: Prepare Your Data
- Code the grouping variable numerically (for example, 1 = Group A, 2 = Group B)
- Ensure the dependent variable contains continuous numeric values
- Check for missing values and outliers
Step 2: Access the T-Test Menu
In SPSS:
- Click Analyze
- Select Compare Means
- Click Independent-Samples T Test
Step 3: Assign Variables
- Move the continuous variable to Test Variable(s)
- Move the grouping variable to Grouping Variable
- Click Define Groups and enter the numeric group codes
Step 4: Run the Test
Click OK to generate the output.
SPSS immediately produces descriptive statistics, Levene’s Test results, and t-test results.
How to Interpret Independent Samples T-Test Output in SPSS
SPSS output includes three critical sections. Understanding each section ensures correct interpretation.
Group Statistics Table
This table displays:
- Sample size for each group
- Mean value for each group
- Standard deviation
Use this table to understand the direction and magnitude of the difference.
Levene’s Test for Equality of Variances
This test determines whether group variances differ significantly.
- If p > 0.05, assume equal variances
- If p ≤ 0.05, do not assume equal variances
This decision tells you which row of the t-test results to interpret.
Independent Samples Test Table
This table reports:
- t-value
- Degrees of freedom
- Significance value (p-value)
- Mean difference
- Confidence interval
If the p-value falls below your chosen alpha level (commonly 0.05), you conclude that a statistically significant difference exists between group means.
SPSS Syntax for Independent Samples T-Test
SPSS syntax improves reproducibility and transparency in statistical analysis.
Basic Independent Samples T-Test Syntax
T-TEST
  GROUPS=group_variable(1 2)
  /VARIABLES=dependent_variable
  /MISSING=ANALYSIS.
Example Syntax
T-TEST
  GROUPS=gender(1 2)
  /VARIABLES=test_score
  /MISSING=ANALYSIS.
This syntax compares mean test scores between two gender groups coded as 1 and 2.
Reporting Independent Samples T-Test Results in APA Style
Accurate reporting ensures academic credibility.
Example APA-Style Interpretation
An independent samples t-test examined differences in test scores between Group A and Group B. Results indicated a statistically significant difference in mean scores between Group A (M = 78.45, SD = 6.32) and Group B (M = 72.10, SD = 7.18), t(58) = 3.62, p = .001. These findings suggest that group membership significantly influenced test performance.
This format includes means, standard deviations, t-value, degrees of freedom, and significance level.
Common Mistakes to Avoid
- Using the test with paired or repeated measures data
- Ignoring Levene’s Test results
- Applying the test to ordinal or categorical dependent variables
- Interpreting the wrong row of SPSS output
Careful assumption checking and output selection prevents these errors.
Conclusion
The independent samples t-test in SPSS remains an essential analytical technique for comparing two independent group means. When applied correctly, it delivers statistically sound conclusions that support data-driven decisions across research domains. Understanding when to use the test, how to perform it in SPSS, how to interpret results, assumptions, and syntax ensures methodological accuracy and credible reporting.