Statistical tools in research play a central role in turning raw data into valid, defensible findings. Whether you are working on a thesis, dissertation, survey project, or journal paper, your choice of statistical tools directly affects the credibility of your results. Many students collect good data but struggle at the analysis stage because they are unsure which statistical methods to apply and how to report them correctly.
Researchers at MSc and PhD level are often expected to independently identify statistical tools, justify their selection, run the analysis in software, and explain the output in academic language. That process can quickly become overwhelming without a clear framework.
This guide explains statistical tools in research methodology, how to identify the right ones, how to use them, and how to write them in your methodology and results chapters. It also includes a structured list of statistical tools in research and practical selection tips for real academic projects.
If you are currently stuck with analysis or tool selection, this guide will give you a working decision structure you can apply immediately.
Not Sure Which Statistical Tool Fits Your Research?
Get expert help selecting the right statistical tests and running your analysis correctly the first time.
Trusted by MSc and PhD researchers • Fast turnaround • Confidential handling
What Is Statistical Tools in Research Methodology
Statistical tools in research methodology refer to the quantitative techniques used to summarize, test, compare, and model data in order to answer research questions and test hypotheses. These tools convert observations into measurable evidence.
In research methodology, statistical tools are selected based on five technical factors: research design, variable type, measurement scale, number of groups, and study objective. Each statistical method answers a specific type of question. For example, a t-test evaluates mean differences between two groups, while regression evaluates predictive relationships.
Statistical tools typically fall into four functional classes. Descriptive tools summarize data patterns. Inferential tools test hypotheses. Relational tools measure associations between variables. Predictive tools model outcomes based on inputs.
When writing your methodology chapter, statistical tools are usually documented under the data analysis section. You are expected to name the test, state why it fits your variables and design, and specify the software used to run it.
Students often confuse data collection instruments with statistical tools. A questionnaire or survey form collects data. Statistical tools analyze that data. Keeping that distinction clear improves methodological clarity and reviewer acceptance.
Importance of Statistical Tools in Research
The importance of statistical tools in research is tied to validity, reliability, and reproducibility. Without proper statistical analysis, research findings remain descriptive opinions rather than tested conclusions.
Statistical tools help researchers detect patterns that are not obvious from raw data tables. They quantify differences, measure uncertainty, and estimate the strength of relationships. This supports evidence based conclusions instead of subjective interpretation.
Another key advantage involves error control. Inferential statistics quantify sampling error and probability levels. This allows researchers to state whether findings are statistically significant or likely due to chance variation.
Statistical tools also support decision making. In applied research fields such as health, business, education, and social science, statistical outputs guide policy recommendations and strategic planning.
From an academic assessment perspective, examiners often evaluate whether the statistical tools selected match the research questions and hypotheses. Even well written research can lose marks when incorrect statistical methods are applied.
Proper use of statistical tools also increases publication acceptance rates since peer reviewers check methodological rigor closely.
List of Statistical Tools in Research
The list of statistical tools in research can be organized by analytical purpose. This classification helps researchers quickly narrow their choices.
Descriptive statistical tools include mean, median, mode, standard deviation, variance, percentages, and frequency distributions. These summarize central tendency and dispersion.
Comparison tools include independent samples t-test, paired t-test, one way ANOVA, two way ANOVA, Mann Whitney U, Wilcoxon signed rank, and Kruskal Wallis tests. These evaluate group differences.
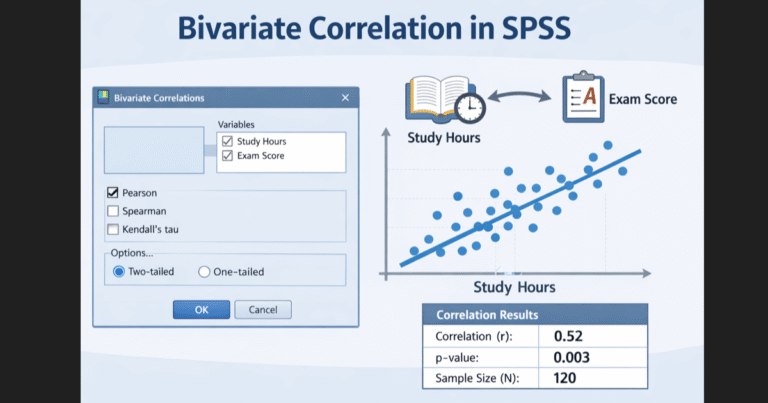
Relationship tools include Pearson correlation, Spearman correlation, chi square test of association, and cross tabulation analysis. These examine whether variables move together.
Predictive and modeling tools include linear regression, multiple regression, logistic regression, generalized linear models, and structural equation modeling. These estimate outcome behavior based on predictors.
Multivariate tools include factor analysis, principal component analysis, cluster analysis, discriminant analysis, and MANOVA. These are used when multiple variables must be analyzed simultaneously.
Reliability and scale validation tools include Cronbach alpha, item total correlation, and split half reliability testing. These are common in survey based research.
Too Many Statistical Tools to Choose From?
We match your research questions with the correct tests and run the full analysis for you.
Methodology aligned • Software experts • Detailed interpretation included
How to Identify Statistical Tools in Research
Knowing how to identify statistical tools in research requires a rule based selection approach rather than guessing. Tool selection should follow variable structure and research objective.
Start with your research questions or hypotheses. Determine whether you are testing differences, relationships, predictions, or classifications. Each objective category maps to a specific tool family.
Next, check your variable measurement scales. Nominal and ordinal variables typically require nonparametric tools or categorical tests. Interval and ratio variables allow parametric tests when assumptions are satisfied.
Then evaluate the number of groups or predictors involved. Two group comparisons point toward t-tests or Mann Whitney tests. Three or more groups point toward ANOVA or Kruskal Wallis tests. Multiple predictors point toward regression models.
Sample size also influences tool choice. Small samples often require nonparametric alternatives because normality assumptions may not hold.
Research design matters as well. Experimental, quasi experimental, cross sectional, and longitudinal designs each support different statistical frameworks.
A practical workflow involves mapping research questions → variable types → group structure → assumptions → final statistical tool. This process reduces methodological errors.
How to Use Statistical Tools in Research
Understanding how to use statistical tools in research involves both procedural and interpretive competence. Software execution alone is not enough. Researchers must check assumptions and interpret outputs correctly.
First prepare your dataset. Clean missing values, verify coding, and check outliers. Statistical results become unreliable when data preparation is weak.
Second run assumption diagnostics where required. Parametric tests require normality, independence, and variance homogeneity checks. These can be tested using plots and formal tests.
Third execute the statistical procedure in your chosen software such as SPSS, R, Stata, or similar platforms. Select correct variable roles such as dependent, independent, factor, or covariate.
Fourth interpret the output tables. Focus on test statistics, p values, confidence intervals, and effect sizes rather than copying entire software output into your report.
Fifth connect statistical findings back to your hypotheses and research questions. Statistical significance should be discussed alongside practical significance.
Students who struggle at this stage often benefit from guided statistical analysis support to avoid incorrect conclusions and reporting mistakes.
Stop Guessing Your Statistical Method
Send your variables and hypotheses. Get a clear statistical plan within hours.
Thesis ready outputs • Reviewer friendly reporting • Unlimited revisions
How to Write Statistical Tools in Research
Many students ask how to write statistical tools in research methodology chapters. Examiners expect precise, technical wording and justification.
You should name each statistical tool, explain its analytical purpose, state the variables involved, and justify why it fits your design. The justification should reference variable type and hypothesis structure.
A correct methodology statement follows a consistent structure: tool name, purpose, variable roles, assumption condition, and software used.
For example, you would state that multiple regression was used to estimate the effect of predictor variables on the outcome variable because the dependent variable was continuous and the model required prediction analysis.
Avoid vague wording such as “statistics were used to analyze the data.” That phrasing lacks technical clarity and reduces academic quality.
Results sections should report test statistics, degrees of freedom where applicable, p values, and effect sizes. Interpretation should be written in plain academic language tied to the hypothesis outcome.
How to Make Statistical Tools in Research Work for Your Project
Students often ask how to make statistical tools in research work effectively for their specific projects. The answer lies in alignment and validation.
Alignment means matching statistical tools with research objectives and variable structures. Validation means checking assumptions and robustness before trusting results.
Pilot testing your survey or measurement instrument improves statistical reliability. Reliability testing such as Cronbach alpha should be performed before running advanced analysis on scale data.
Simulation and preliminary descriptive analysis help detect data issues early. This prevents running advanced models on flawed datasets.
Consultation with a statistical expert can save time and prevent methodological rejection, especially for dissertations and journal submissions.
If you are unsure which tool to apply or how to interpret output, getting expert statistical guidance can significantly improve research quality and grading outcomes.
Finish Your Research Analysis With Confidence
Professional statistical support for dissertations, thesis, and research projects.
✔ Confidential • ✔ Deadline focused • ✔ Research grade reporting