Bivariate correlation is a statistical method used to measure the strength and direction of the relationship between two variables. The term “bivariate” simply means that only two variables are involved in the analysis. The purpose of bivariate correlation is to determine whether changes in one variable are associated with changes in another variable.
Correlation coefficients range between –1 and +1. A value close to +1 indicates a strong positive relationship, meaning that as one variable increases, the other also increases. If a value is close to –1, it indicates a strong negative relationship, meaning that as one variable increases, the other decreases. A value close to 0 suggests little or no linear relationship between the variables.
It is important to understand that correlation measures association, not causation. Even if two variables show a strong correlation, this does not imply that one variable causes changes in the other. External variables, reverse causality, or coincidence may explain the relationship.
Types of Bivariate Correlation in SPSS
SPSS allows you to compute several types of bivariate correlations. Choosing the correct one depends on the level of measurement and distribution of your variables.
Pearson Correlation
Pearson correlation is the most commonly used bivariate correlation method. It measures the linear relationship between two continuous variables that are approximately normally distributed. Pearson correlation assumes interval or ratio-level data and is sensitive to outliers.
Spearman Correlation
Spearman correlation is a nonparametric alternative to Pearson correlation. It is used when variables are ordinal, not normally distributed, or contain outliers that violate Pearson’s assumptions. Spearman correlation assesses monotonic relationships rather than strictly linear ones.
Kendall’s Tau
Kendall’s Tau is another nonparametric correlation coefficient, often used with small sample sizes or data containing many tied ranks. While available in SPSS, it is used less frequently than Pearson or Spearman.
In most research contexts, bivariate correlation in SPSS refers primarily to Pearson or Spearman correlation, both of which are accessible through the same menu.
When Should You Use Bivariate Correlation?
Bivariate correlation in SPSS is appropriate when:
- You want to examine the relationship between two variables
- Both variables are numeric or ordinal
- You are not testing cause-and-effect
- Your research question focuses on association or relationship strength
Common research scenarios include examining the relationship between study time and exam scores, income and job satisfaction, stress levels and academic performance, or age and technology adoption.
Bivariate correlation should not be used when you have more than two variables of interest simultaneously, when variables are categorical without meaningful order, or when the research goal is prediction or causal inference.
Assumptions of Bivariate Correlation
Before running bivariate correlation in SPSS, it is critical to evaluate whether your data meet the necessary assumptions.
For Pearson correlation, the assumptions include:
- Both variables are continuous
- The relationship is linear
- The variables are approximately normally distributed
- There are no significant outliers
For Spearman correlation, the assumptions are less strict:
- Variables are ordinal or continuous
- The relationship is monotonic
- Outliers have less impact
Failing to meet these assumptions can lead to misleading correlation coefficients and incorrect conclusions.
How to Run Bivariate Correlation in SPSS (Step-by-Step)
- Open your dataset in SPSS
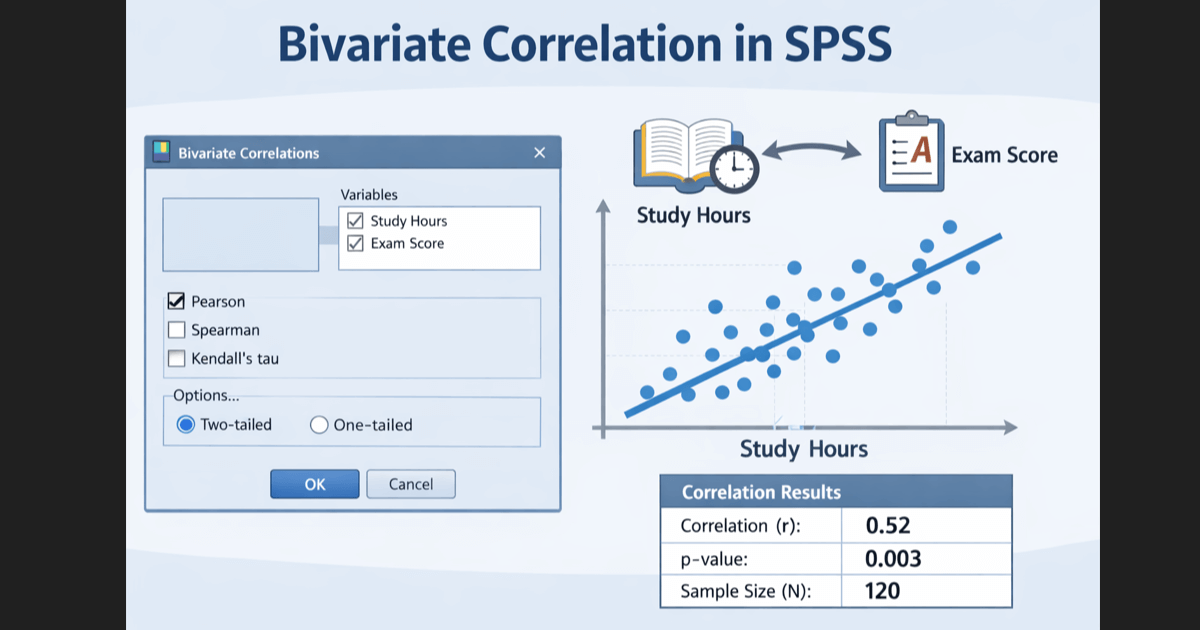
- Click Analyze → Correlate → Bivariate
- Move your two variables into the box
- Select:
- Pearson (most common)
- OR Spearman (nonparametric)
- Choose Two-tailed
- Click OK
How to Interpret Bivariate Correlation Output in SPSS
The SPSS output table contains three key pieces of information for each variable pair.
The correlation coefficient indicates the strength and direction of the relationship. Values closer to ±1 indicate stronger relationships, while values near zero indicate weak or no relationship.
The significance value (p-value) indicates whether the observed correlation is statistically significant. A p-value below 0.05 is typically considered statistically significant, meaning the relationship is unlikely to be due to chance.
The sample size (N) shows how many cases were included in the analysis. Always verify that missing data have not reduced your effective sample size unexpectedly.
Interpreting correlation strength depends on context, but general guidelines suggest that values around 0.1 are weak, around 0.3 are moderate, and above 0.5 are strong.
Common Mistakes in Bivariate Correlation Analysis
One of the most common mistakes is interpreting correlation as causation. A significant correlation does not prove that one variable causes changes in another.
Another frequent error is using Pearson correlation when assumptions are violated. Non-normal data or extreme outliers should prompt the use of Spearman correlation instead.
Researchers also often fail to report correlation results correctly, omitting key information such as the correlation coefficient, sample size, or significance level.
Ignoring data screening steps, such as checking for outliers and linearity, can further undermine the validity of the analysis.
How to Report Bivariate Correlation Results
When reporting bivariate correlation results in academic or professional work, clarity and completeness are essential.
A proper report includes:
- The type of correlation used
- The correlation coefficient
- The significance level
- The sample size
For example, you might report that there was a statistically significant positive correlation between study time and exam performance, with a Pearson correlation coefficient of 0.45, a p-value below 0.01, and a sample size of 120.
Tables and figures may be included where appropriate, but narrative interpretation should always accompany numerical results.
Conclusion
Bivariate correlation in SPSS is a foundational statistical technique that allows researchers to explore relationships between two variables in a clear and interpretable way. When used correctly, it provides valuable insight into patterns within data and supports evidence-based conclusions across a wide range of research fields.
By understanding the different types of bivariate correlation, checking assumptions, running the analysis correctly in SPSS, and interpreting the output carefully, you can avoid common pitfalls and strengthen the credibility of your findings. Proper reporting ensures that your results are transparent, replicable, and academically sound.
If you are working on a research project, dissertation, or survey study and need expert support with correlation analysis in SPSS, professional guidance can save time, reduce errors, and improve the quality of your results.