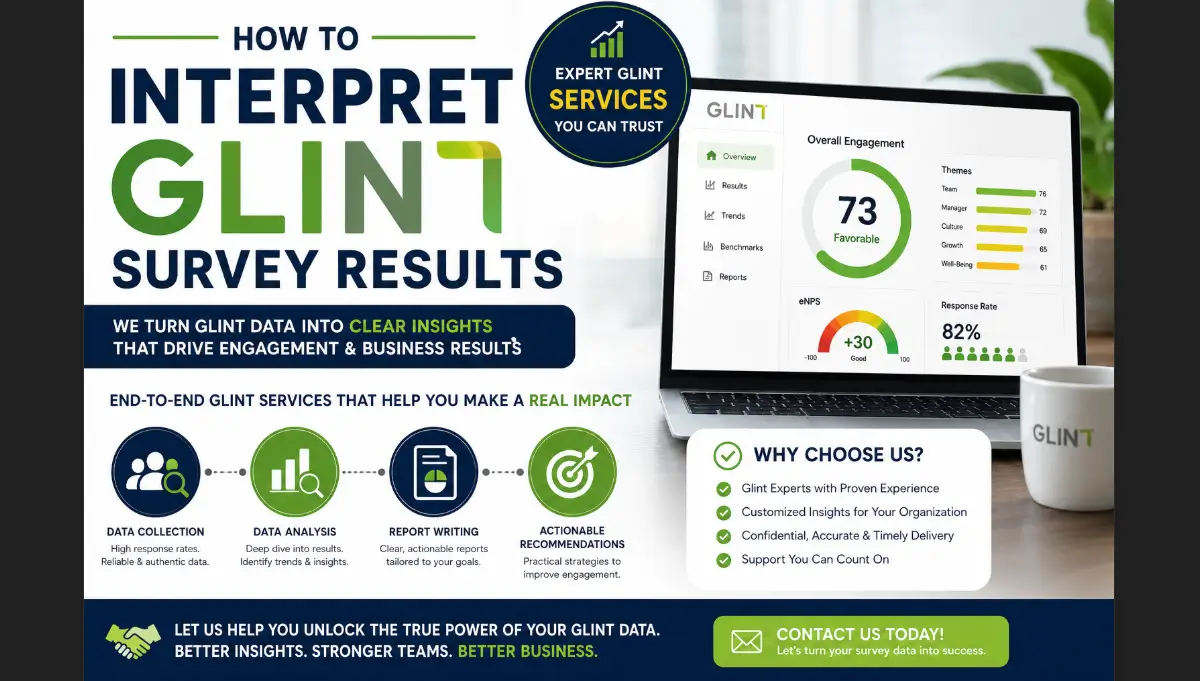
Many HR teams, people analytics professionals, and business leaders struggle after receiving their Glint survey results. While the Glint dashboard provides valuable information about employee engagement, workplace culture, leadership effectiveness, and organizational performance, understanding what the results actually mean can be challenging.
A Glint survey is designed to capture employee feedback and identify factors that influence engagement, retention, productivity, and employee satisfaction. However, many organizations find themselves overwhelmed by engagement scores, heatmaps, benchmarks, driver analysis, and employee comments. Without proper interpretation, valuable insights can remain hidden, making it difficult to identify priorities and develop effective action plans.
If you are wondering what your Glint score means, how Glint engagement scores are calculated, why certain departments are underperforming, or how to create an employee improvement plan based on survey findings, you are not alone. Organizations across industries frequently seek expert assistance to analyze employee engagement survey results and transform feedback into measurable business improvements.
This guide explains how to interpret Glint survey results, understand Glint engagement scores, analyze employee comments, evaluate benchmarks, and develop meaningful action plans. It also highlights how professional survey analysis services from MySPSSHelp.com can help organizations maximize the value of their employee feedback initiatives.
Struggling to Understand Your Glint Survey Results?
Many organizations invest significant time and resources collecting employee feedback but never fully utilize the insights hidden within their Glint data.
Common challenges include:
- Low engagement scores with no obvious explanation
- Conflicting results across departments
- Large volumes of employee comments that are difficult to analyze
- Uncertainty about which issues require immediate action
- Difficulty presenting findings to executives and stakeholders
- Lack of a clear employee improvement plan
At MySPSSHelp.com, we help organizations move beyond raw survey results. Our specialists provide professional Glint survey analysis, executive-ready reporting, employee engagement insights, action planning recommendations, and ongoing consultation support.
Whether you need help interpreting a single Glint survey or managing an enterprise-wide employee listening program, our team can help transform complex data into clear business decisions.
Related services:
- Survey Data Analysis
- Questionnaire Data Analysis
- Professional Survey Design and Analysis Help
- Dissertation Data Analysis Services
What Are Glint Survey Results?
Glint survey results represent employee feedback collected through Microsoft’s employee engagement platform. These results provide organizations with insights into employee experiences, workplace culture, leadership effectiveness, communication quality, career development opportunities, and overall engagement levels.
The Glint dashboard typically presents results through:
- Engagement scores
- Favorability ratings
- Heatmaps
- Driver analysis
- Benchmark comparisons
- Trend reports
- Employee comments
- Team-level analytics
The purpose of Glint reporting is not simply to measure employee satisfaction but to identify the factors that influence organizational performance. By understanding these factors, leaders can make informed decisions that improve employee engagement and business outcomes.
Organizations that effectively analyze Glint results are often better positioned to reduce turnover, improve productivity, strengthen workplace culture, and enhance employee retention.
For organizations requiring deeper statistical analysis, professional survey data analysis services can help uncover patterns and relationships that may not be immediately visible within standard dashboard reports.
What Is a Glint Engagement Score?
One of the most frequently searched topics related to Glint is the Glint engagement score.
A Glint engagement score is a key metric used to measure employees’ emotional commitment to their organization and their willingness to contribute to organizational success. It is typically derived from responses to specific engagement-related survey questions.
The engagement score often reflects employee perceptions regarding:
- Pride in working for the organization
- Intent to stay with the company
- Willingness to recommend the organization as a workplace
- Motivation to perform at a high level
Higher engagement scores generally indicate stronger employee commitment and positive workplace experiences. Lower scores may signal concerns related to leadership, communication, workload, recognition, career growth, or organizational culture.
However, engagement scores should never be interpreted in isolation. A score alone does not explain why employees feel a certain way. Organizations must examine supporting data, comments, and engagement drivers to identify the root causes behind the results.
Understanding the context behind engagement scores is essential for developing effective interventions and improvement strategies.
How Is a Glint Score Calculated?
Another common question is how Glint score calculation works.
While Microsoft does not publicly disclose every aspect of its proprietary methodology, Glint scores are generally based on employee responses to survey questions using Likert-scale ratings.
The calculation process typically involves:
- Collecting employee responses.
- Converting responses into numerical values.
- Calculating favorability percentages.
- Aggregating responses across engagement-related questions.
- Generating overall engagement metrics.
For example, favorable responses such as “Agree” or “Strongly Agree” may contribute positively to engagement calculations, while neutral or unfavorable responses may reduce overall scores.
Organizations should focus less on the exact mathematical formula and more on understanding what drives score changes over time. Trends, comparisons, and driver analysis often provide more actionable insights than the score itself.
If your organization requires advanced statistical interpretation of employee survey data, our questionnaire data analysis services can provide deeper insights into employee perceptions and organizational performance.
How to Analyze Glint Survey Results Effectively
Analyzing Glint survey results requires a structured approach that goes beyond reviewing headline metrics.
Review Overall Engagement Scores
Begin by examining overall engagement scores and identifying significant changes compared to previous survey cycles.
Questions to consider include:
- Has engagement improved or declined?
- Which departments show the strongest results?
- Which teams require immediate attention?
- Are there notable differences across locations or demographic groups?
Trend analysis helps organizations identify emerging issues before they become major problems.
Examine Driver Analysis
Driver analysis identifies the factors most strongly associated with employee engagement.
Common engagement drivers include:
- Leadership effectiveness
- Career development
- Recognition
- Communication
- Inclusion and belonging
- Work-life balance
- Manager support
Understanding these drivers helps organizations prioritize initiatives that are most likely to improve engagement outcomes.
Analyze Team-Level Results
Departmental and team-level analysis often reveals important variations hidden within organization-wide averages.
For example:
- One department may have exceptionally high engagement.
- Another may struggle with leadership concerns.
- Certain teams may report communication challenges.
These insights enable targeted interventions rather than broad organizational changes.
Understanding Heatmaps and Benchmark Comparisons
Heatmaps are among the most valuable features within the Glint dashboard.
Heatmaps visually display survey results across teams, departments, and organizational units. They help leaders quickly identify areas of strength and concern.
Benefits of heatmap analysis include:
- Identifying low-performing teams
- Detecting engagement hotspots
- Comparing departments
- Prioritizing interventions
Benchmark comparisons provide additional context by comparing organizational results against industry standards or peer organizations.
Benchmark analysis helps answer questions such as:
- Are our engagement scores competitive?
- How do we compare with similar organizations?
- Which areas exceed industry expectations?
- Where do we lag behind competitors?
Combining benchmark data with internal analysis creates a more comprehensive understanding of organizational performance.
For official information about Glint reporting and analytics, organizations can refer to the Microsoft Viva Glint platform: https://www.microsoft.com/en-us/microsoft-viva/glint
Analyzing Employee Comments and Qualitative Feedback
Employee comments often contain the most actionable insights within Glint survey results.
While quantitative scores indicate what employees think, comments explain why they feel that way.
Organizations should systematically analyze comments to identify:
- Recurring themes
- Common concerns
- Positive experiences
- Suggestions for improvement
- Emerging workplace issues
Qualitative analysis techniques include:
- Thematic coding
- Sentiment analysis
- Content categorization
- Trend identification
Organizations that ignore employee comments risk overlooking critical issues that may not be reflected in numerical scores.
Learn more about qualitative data analysis and effective methods for interpreting employee feedback.
Creating an Employee Improvement Plan From Glint Results
Collecting employee feedback is only valuable if organizations take meaningful action.
An employee improvement plan should be based directly on survey findings and focus on addressing the most significant engagement drivers.
Effective improvement plans typically include:
Identifying Priority Areas
Focus on issues that have the greatest impact on engagement and organizational performance.
Setting Measurable Goals
Examples include:
- Improving engagement scores by a specific percentage
- Increasing manager effectiveness ratings
- Enhancing communication satisfaction
- Reducing turnover intentions
Assigning Accountability
Clearly define who is responsible for implementing each initiative.
Monitoring Progress
Track improvements through pulse surveys, follow-up assessments, and ongoing employee feedback.
Organizations that consistently act on survey findings often achieve stronger engagement outcomes and greater employee trust.
For additional guidance, review our resource on how to analyze survey data.
Common Mistakes When Interpreting Glint Results
Many organizations make avoidable mistakes when reviewing employee engagement survey results.
Common errors include:
Focusing Only on Scores
Scores provide useful information but rarely explain underlying causes.
Ignoring Employee Comments
Comments often reveal critical context behind engagement metrics.
Overreacting to Small Changes
Minor fluctuations may not indicate meaningful organizational changes.
Failing to Prioritize Actions
Attempting to address every issue simultaneously can dilute resources and reduce effectiveness.
Not Communicating Results
Employees expect transparency. Sharing findings and planned actions helps build trust and credibility.
Avoiding these mistakes can significantly improve the effectiveness of employee listening programs.
Need Help Interpreting Your Glint Survey Results?
Many organizations collect employee feedback but struggle to convert survey data into actionable business insights.
At MySPSSHelp.com, we provide professional support for organizations seeking expert assistance with Glint survey analysis and employee engagement reporting.
Our services include:
- Glint survey result interpretation
- Employee engagement score analysis
- Driver analysis and benchmarking
- Employee comment analysis
- Executive reporting and presentations
- Employee improvement plan development
- Survey design and optimization
- Ongoing employee listening strategy support
Related services include:
- Survey Design Services
- Professional Survey Design and Analysis Help
- Survey Data Analysis
- Online Survey Experts
Whether you need assistance interpreting a single Glint dashboard or managing a large-scale employee engagement initiative, our experts can help transform complex survey data into practical recommendations that drive measurable organizational improvements.
Conclusion
Glint survey results provide valuable insights into employee engagement, workplace culture, leadership effectiveness, and organizational performance. However, understanding what the data means and determining the appropriate actions often requires careful analysis.
By examining engagement scores, driver analysis, heatmaps, benchmarks, and employee comments, organizations can identify meaningful opportunities for improvement and develop targeted action plans.
Most importantly, employee feedback should lead to action. Organizations that actively respond to survey findings are more likely to improve engagement, strengthen retention, enhance productivity, and build a positive workplace culture.
If your organization needs expert assistance interpreting Glint survey results, analyzing employee engagement data, or developing an employee improvement plan, visit MySPSSHelp.com to learn how our survey analysis specialists can help you turn employee feedback into measurable business success.
Frequently Asked Questions About Glint Survey Results
1. How do I interpret Glint survey results?
To interpret Glint survey results effectively, start by reviewing overall engagement scores, driver analysis, benchmark comparisons, heatmaps, and employee comments. Rather than focusing only on scores, organizations should identify patterns, recurring themes, and key engagement drivers that influence employee experiences. Many companies also seek professional survey analysis support to ensure accurate interpretation and actionable recommendations.
2. What is a good Glint engagement score?
A good Glint engagement score varies by industry, organization size, and workforce characteristics. The most important factor is how your score compares with previous survey cycles and relevant benchmarks. Organizations should focus on continuous improvement rather than achieving a specific score.
3. What does a low Glint engagement score mean?
A low Glint engagement score may indicate concerns related to leadership, communication, recognition, workload, career development, or workplace culture. Additional analysis is necessary to identify the root causes behind lower engagement levels.
4. How is a Glint score calculated?
Glint scores are generally calculated using employee responses to survey questions, favorability ratings, and engagement-related metrics. Responses are converted into measurable indicators that help organizations evaluate employee sentiment and engagement trends over time.
5. What is the difference between Glint survey results and engagement scores?
Engagement scores represent a single measure of employee commitment and satisfaction, while Glint survey results include a broader range of insights such as driver analysis, benchmark comparisons, heatmaps, trends, and employee comments. Organizations should review the full dataset before making decisions.
6. How often should organizations review Glint survey results?
Organizations should review Glint results immediately after each survey cycle and continue monitoring progress through regular pulse surveys and action-planning reviews. Consistent analysis helps leaders identify emerging issues and measure improvement efforts.
7. What are Glint engagement drivers?
Glint engagement drivers are factors that influence employee engagement levels. Common drivers include leadership effectiveness, manager support, recognition, communication, career growth opportunities, workplace inclusion, and work-life balance. Understanding these drivers helps organizations prioritize improvement initiatives.
8. How do heatmaps help analyze Glint survey results?
Heatmaps visually display employee survey scores across teams, departments, locations, or demographic groups. They help leaders identify areas of strength, detect engagement challenges, and prioritize interventions based on patterns within the organization.
9. How should employee comments be analyzed in Glint?
Employee comments should be reviewed using thematic analysis and sentiment analysis techniques. Organizations should identify recurring concerns, positive experiences, and common recommendations to better understand the context behind engagement scores.
10. Can MySPSSHelp.com help interpret Glint survey results?
Yes. MySPSSHelp.com provides professional support for organizations that need help interpreting Glint survey results, analyzing employee engagement data, reviewing comments, creating executive reports, and developing employee improvement plans. Our experts help transform complex survey findings into actionable business insights.
11. What should be included in a Glint employee improvement plan?
An effective employee improvement plan should identify key engagement challenges, establish measurable goals, assign accountability, define timelines, and track progress through follow-up surveys and performance indicators. The plan should be directly linked to survey findings.
12. Why are Glint survey results important?
Glint survey results help organizations understand employee experiences, identify engagement drivers, improve workplace culture, reduce turnover risks, and make data-driven decisions. Proper interpretation allows leaders to address concerns before they affect organizational performance.
13. Are Glint surveys really anonymous?
Glint surveys are designed to protect employee confidentiality through reporting thresholds and privacy controls. However, anonymity policies may vary depending on how the survey is configured and administered within an organization. Employees should review their organization’s survey privacy guidelines for specific details.
14. What is the meaning of a Glint survey?
A Glint survey is an employee engagement and employee experience survey used to gather feedback on workplace culture, leadership, communication, career development, well-being, and other factors that influence employee satisfaction and organizational performance.
15. How can organizations turn Glint survey results into action?
Organizations should begin by identifying key engagement drivers, analyzing employee feedback, prioritizing improvement opportunities, creating action plans, and monitoring progress over time. Many organizations partner with survey analysis specialists such as MySPSSHelp.com to accelerate this process and maximize the value of employee feedback.