The chi square test in SPSS allows researchers to examine whether a statistically significant association exists between two categorical variables. Researchers widely use this test in psychology, education, health sciences, business, and social research when they need to analyze relationships between groups, categories, or classifications.
This guide explains how to run a chi square test in SPSS, how to read SPSS output tables, how to interpret chi square results correctly, how to conduct post hoc chi square analysis, and how to report findings clearly for theses, dissertations, and journal articles.
What Is a Chi Square Test in SPSS?
The chi square test evaluates whether the observed frequencies in a contingency table differ significantly from expected frequencies. Instead of comparing means, this test compares counts or proportions across categories.
For example, a researcher may test whether gender relates to program choice or whether treatment group relates to recovery status. In each case, both variables are categorical.
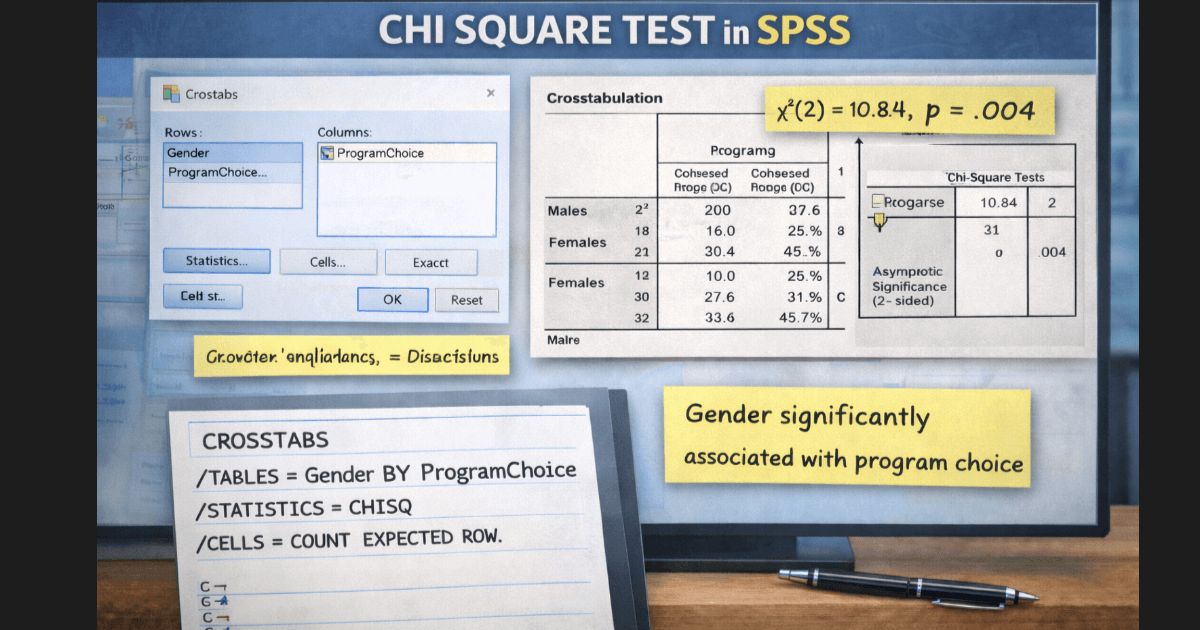
SPSS performs the chi square test through the Crosstabs procedure.
When to Use Chi Square in SPSS
Researchers should use a chi square test in SPSS when:
- Both variables are categorical
- Data represent counts or frequencies
- Observations remain independent
- Each case appears in only one category
If expected cell counts fall too low, researchers should consider Fisher’s Exact Test instead.
Assumptions of the Chi Square Test in SPSS
Before interpreting results, researchers must verify key assumptions.
Independence of Observations
Each participant or case must contribute to only one cell in the table.
Expected Cell Frequencies
At least 80 percent of cells should have expected counts of 5 or more. SPSS reports expected counts automatically.
Meeting these assumptions ensures valid chi square results.
How to Run a Chi Square Test in SPSS
To perform the analysis correctly, follow these steps carefully.
- Click Analyze
- Select Descriptive Statistics
- Choose Crosstabs
Next, move one categorical variable into the Row(s) box and the other into the Column(s) box.
Then:
- Click Statistics
- Check Chi-square
- Click Continue
After that:
- Click Cells
- Select Observed, Expected, and Row percentages
- Click Continue
Finally, click OK to run the analysis.
Chi Square SPSS Output Explained
Understanding SPSS output is essential for accurate interpretation.
Crosstabulation Table
This table displays observed and expected frequencies for each category combination. Researchers use it to understand data distribution and direction of association.
Chi-Square Tests Table
This table provides the test statistics.
Key values include:
- Pearson Chi-Square value
- Degrees of freedom
- Significance (p-value)
A p-value below .05 indicates a statistically significant association between the variables.
Chi Square SPSS Interpretation
Correct chi square SPSS interpretation follows a clear sequence.
- Check the Pearson Chi-Square p-value
- Confirm that expected cell counts meet assumptions
- Examine row or column percentages
- Describe the direction of association
Example interpretation:
A chi square test showed a significant association between gender and program choice, χ²(2) = 10.84, p = .004.
How to Interpret Chi Square Results in SPSS
Statistical significance alone does not explain where differences occur. Researchers must examine the crosstab percentages to interpret patterns.
For example, one group may show a higher proportion in a specific category, indicating the practical nature of the association.
Clear interpretation combines statistics with descriptive explanation.
Effect Size for Chi Square in SPSS
Effect size measures the strength of association, not just significance.
SPSS does not automatically report effect size for chi square tests, but researchers commonly calculate:
- Phi for 2×2 tables
- Cramér’s V for larger tables
Guidelines for Cramér’s V:
- 0.10 = small association
- 0.30 = medium association
- 0.50 = large association
Researchers should always report effect size with chi square results.
Post Hoc Chi Square SPSS Analysis
When a chi square test involves more than two categories, a significant result does not identify which groups differ.
Post hoc chi square analysis involves:
- Examining standardized residuals
- Running pairwise chi square tests with adjusted alpha levels
Standardized residuals above ±1.96 indicate cells that contribute strongly to the overall association.
Reporting Chi Square Results (APA Style)
A complete APA-style report includes:
- Test name
- Chi square value
- Degrees of freedom
- p-value
- Effect size
Example:
A chi square test of independence indicated a significant association between treatment group and recovery status, χ²(1) = 6.32, p = .012, Cramér’s V = .29.
Confused by Chi Square Results in SPSS?
Get expert help with test setup, assumption checks, output interpretation, post hoc analysis, and APA-ready reporting for your thesis or dissertation.
Free initial data review. Clear interpretation. Fast turnaround
Chi Square Test SPSS Syntax
Researchers can run a chi square test of independence in SPSS using the CROSSTABS command. Syntax ensures accuracy, transparency, and reproducibility.
Basic Chi Square Test Syntax
Use this syntax to compute a chi square test between two categorical variables:
CROSSTABS
  /TABLES = variable1 BY variable2
  /STATISTICS = CHISQ
  /CELLS = COUNT EXPECTED ROW.
Replace variable1 and variable2 with the actual categorical variable names in your dataset.
This command produces:
- Pearson Chi-Square test
- Observed and expected frequencies
- Row percentages for interpretation
Chi Square With Effect Size (Phi and Cramér’s V)
To request effect size measures, use this syntax:
CROSSTABS
  /TABLES = variable1 BY variable2
  /STATISTICS = CHISQ PHI
  /CELLS = COUNT EXPECTED ROW.
SPSS reports:
- Phi for 2×2 tables
- Cramér’s V for larger contingency tables
Researchers should always report effect size alongside significance.
Chi Square With Standardized Residuals (Post Hoc Analysis)
To identify which cells contribute most to a significant chi square result, run:
CROSSTABS
  /TABLES = variable1 BY variable2
  /STATISTICS = CHISQ PHI
  /CELLS = COUNT EXPECTED ROW RESIDUALS.
Standardized residuals greater than ±1.96 indicate cells that contribute strongly to the association.
Fisher’s Exact Test Syntax (Small Sample Sizes)
When expected cell counts fall below 5, use Fisher’s Exact Test:
CROSSTABS
  /TABLES = variable1 BY variable2
  /STATISTICS = CHISQ
  /CELLS = COUNT EXPECTED
  /EXACT = FISHER.
This option improves accuracy for small samples and sparse tables.
Common Mistakes in Chi Square SPSS Analysis
Researchers often make avoidable errors:
- Using chi square with continuous variables
- Ignoring low expected cell counts
- Reporting significance without effect size
- Failing to interpret residuals
These mistakes weaken analytical credibility and invite reviewer criticism.
When to Seek Expert SPSS Help
Chi square analysis becomes complex when tables include many categories or small cell counts. Misinterpretation of output often leads to incorrect conclusions.
Professional SPSS dissertation help ensures correct test selection, accurate interpretation, proper post hoc analysis, and APA-compliant reporting.
Conclusion
The chi square test in SPSS provides a powerful method for examining relationships between categorical variables. When researchers run the test correctly, interpret output carefully, and report effect size alongside significance, the results remain both statistically and substantively meaningful.