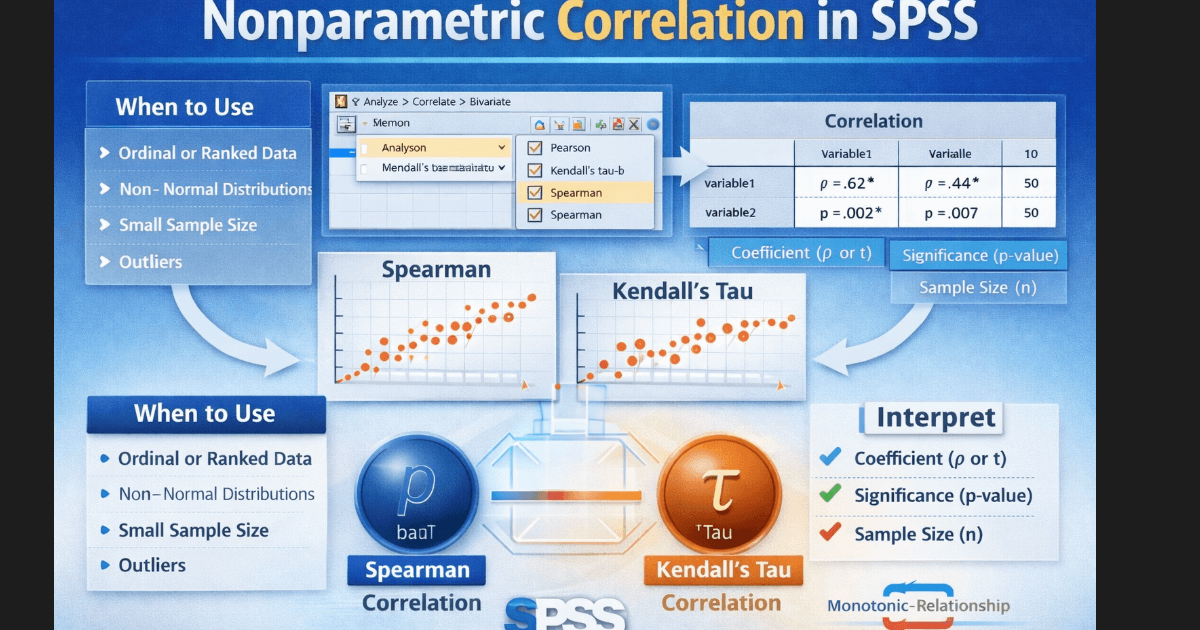
Researchers often analyze relationships between variables that violate the assumptions required for Pearson correlation. In such cases, nonparametric correlation in SPSS provides a robust and statistically appropriate alternative. Nonparametric correlation methods measure the strength and direction of association without requiring normal distributions, linearity, or equal variances.
SPSS supports two primary nonparametric correlation techniques: Spearman’s rank-order correlation and Kendall’s tau. These methods work particularly well with ordinal data, skewed distributions, small sample sizes, and datasets with outliers.
This article explains what nonparametric correlation is, when to use nonparametric correlation in SPSS, how to perform it step by step, assumptions, how to interpret results, and SPSS syntax. The guide targets students, researchers, and professionals who need statistically defensible correlation analysis.
What Is Nonparametric Correlation?
Nonparametric correlation measures the relationship between two variables using ranked or ordinal information rather than raw numeric values. Unlike Pearson correlation, nonparametric methods do not rely on strict distributional assumptions.
Instead of comparing actual values, these methods compare relative ordering. As one variable increases, nonparametric correlation evaluates whether the other variable tends to increase or decrease in a consistent pattern.
SPSS offers two widely accepted nonparametric correlation coefficients:
- Spearman’s rho (ρ)
- Kendall’s tau (τ)
Both coefficients range from −1 to +1, where values closer to −1 or +1 indicate stronger associations.
When to Use Nonparametric Correlation in SPSS
You should use nonparametric correlation in SPSS when your data fails to meet Pearson correlation requirements or when your measurement scale demands a rank-based approach.
Appropriate Use Cases
Use nonparametric correlation when:
- Your variables use ordinal scales (Likert-type responses)
- Your data shows non-normal distributions
- Your sample size remains small
- Your data includes outliers that distort Pearson correlation
- The relationship appears monotonic but not linear
Practical Research Examples
- Examining the relationship between satisfaction ratings and service quality ranks
- Studying associations between ranked academic performance and motivation levels
- Analyzing survey responses with skewed distributions
Types of Nonparametric Correlation in SPSS
Spearman’s Rank-Order Correlation
Spearman correlation in SPSS assesses monotonic relationships by converting raw values into ranks. It works well with ordinal data and continuous data that violates normality.
Key characteristics:
- Uses ranked data
- Handles non-normal distributions
- Detects monotonic relationships
Kendall’s Tau Correlation
Kendall’s tau evaluates the strength of association by comparing concordant and discordant pairs of observations.
Key characteristics:
- Performs well with small samples
- Produces conservative estimates
- Handles tied ranks effectively
Researchers often prefer Kendall’s tau when sample sizes remain limited or when many tied ranks appear in the data.
Assumptions of Nonparametric Correlation
Although nonparametric methods relax many assumptions, they still require specific conditions.
Key Assumptions
- Each variable contains ordinal, interval, or ratio data
- Observations remain independent
- The relationship follows a monotonic pattern
Nonparametric correlation does not require normality, linearity, or homoscedasticity, which makes it suitable for real-world data.
How to Perform Nonparametric Correlation in SPSS
Step 1: Prepare Your Dataset
- Ensure each variable occupies its own column
- Check for missing values
- Verify correct measurement scales
Step 2: Open the Correlation Menu
In SPSS:
- Click Analyze
- Select Correlate
- Click Bivariate
Step 3: Select Correlation Type
- Move variables into the analysis box
- Select Spearman or Kendall’s tau-b
- Uncheck Pearson if not needed
- Choose two-tailed or one-tailed testing based on hypotheses
Step 4: Run the Analysis
Click OK to generate output.
SPSS produces a correlation matrix containing correlation coefficients and significance values.
SPSS Support
Precision in Nonparametric Analysis
Confused by Spearman or Kendall Correlation Results in SPSS?
Expert support for ordinal data, non-normal distributions, and small samples.
Our statisticians help you choose the correct nonparametric correlation, run the analysis in SPSS, interpret coefficients accurately, and report results in APA format.
Official Support
myspsshelp.com
How to Interpret Nonparametric Correlation Output in SPSS
SPSS displays correlation results in a table format that includes coefficient values, significance levels, and sample size.
Correlation Coefficient Interpretation
- ±0.10 to ±0.29: Weak association
- ±0.30 to ±0.49: Moderate association
- ±0.50 and above: Strong association
The sign indicates direction:
- Positive values indicate increasing relationships
- Negative values indicate decreasing relationships
Significance Value (p-value)
- p < 0.05 indicates a statistically significant association
- p ≥ 0.05 indicates no statistically significant association
SPSS Syntax for Nonparametric Correlation
SPSS syntax improves transparency and reproducibility.
Spearman Correlation Syntax
NONPAR CORR
  /VARIABLES=var1 var2
  /PRINT=SPEARMAN
  /MISSING=PAIRWISE.
Kendall’s Tau Syntax
NONPAR CORR
  /VARIABLES=var1 var2
  /PRINT=KENDALL
  /MISSING=PAIRWISE.
You can extend this syntax to include multiple variables in the same analysis.
Example Nonparametric Correlation in APA Style
A Spearman rank-order correlation examined the relationship between study time and exam performance. Results showed a moderate positive association, rs = .42, p = .003, indicating that higher study time aligned with higher exam scores.
Common Mistakes to Avoid
- Using Pearson correlation despite violated assumptions
- Ignoring monotonicity requirements
- Misinterpreting correlation as causation
- Reporting significance without effect size
Conclusion
Nonparametric correlation in SPSS offers a powerful solution when data fails to meet parametric assumptions. Spearman’s rho and Kendall’s tau allow researchers to evaluate relationships accurately using ranked information. By understanding when to use nonparametric correlation, how to perform it in SPSS, how to interpret results, and how to report findings, you ensure statistically valid conclusions.