Pearson correlation remains one of the most searched statistical procedures by students and researchers working with quantitative data. Pearson correlation appears frequently in academic research, dissertations, and applied data analysis. However, incorrect interpretation often leads to weak conclusions and reviewer criticism. This article explains Pearson correlation SPSS in clear, practical terms. It focuses on calculation, output interpretation, and correct reporting, while addressing common questions researchers actively search for across search engines and research resources.
What Is Pearson Correlation?
Pearson correlation measures the strength and direction of a linear relationship between two continuous variables. Researchers commonly denote it as Pearson’s r. The statistic evaluates whether increases or decreases in one variable align with systematic changes in another variable.
The value of Pearson’s r ranges from –1 to +1:
- +1 indicates a perfect positive linear relationship
- –1 indicates a perfect negative linear relationship
- 0 indicates no linear relationship
Pearson correlation focuses exclusively on linear associations. Analysis of research queries shows that confusion often arises when users apply Pearson correlation to non-linear data or ordinal variables. In such cases, the coefficient may misrepresent the true relationship.
Pearson Correlation Meaning in Research
In research, Pearson correlation answers a focused question:
Do two quantitative variables move together in a linear pattern, and how strong is that association?
Examples include:
- Study hours and academic performance
- Stress levels and sleep duration
- Income and consumer spending
Pearson correlation does not explain why variables relate. It only quantifies the relationship. Many educational resources emphasize this distinction because correlation does not establish causation, regardless of statistical significance.
SPSS simplifies this analysis through its bivariate correlation procedure, which explains why pearson correlation SPSS tutorial and bivariate Pearson correlation SPSS appear frequently in search results.
How Pearson Correlation Works
SPSS calculates Pearson correlation by standardizing the covariance between two variables using their standard deviations. This process removes unit dependency, which allows meaningful comparison between variables measured on different scales.
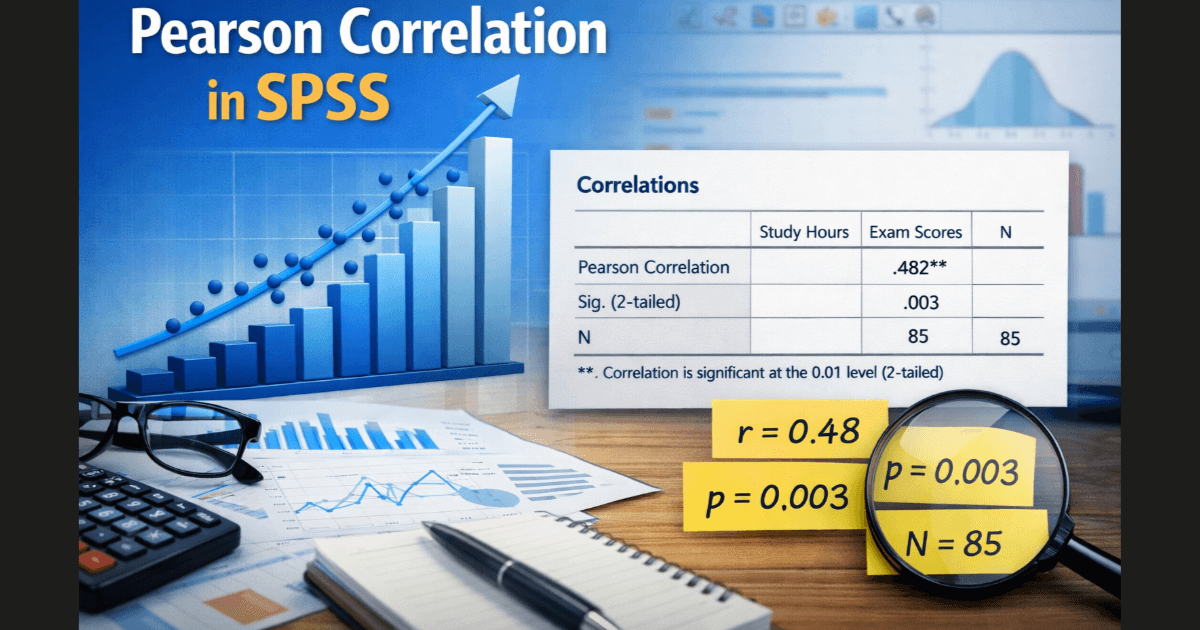
SPSS presents results in a Correlations table, which includes:
- Pearson correlation coefficient (r)
- Significance value (p value)
- Sample size (N)
Understanding this table remains essential, especially for users searching for pearson correlation SPSS output or pearson correlation SPSS output interpretation.
How to Calculate Pearson Correlation in SPSS
To calculate Pearson correlation SPSS correctly, follow these steps:
- Open SPSS and import your dataset
- Select Analyze from the menu bar
- Click Correlate, then choose Bivariate
- Move your variables into the Variables box
- Ensure Pearson is selected
- Choose Two-tailed unless theory requires otherwise
- Click OK
SPSS immediately generates the correlation output. Many users searching for how to do Pearson correlation SPSS stop here, but correct interpretation requires further analysis.
How to Read SPSS Pearson Correlation Output
The SPSS Pearson correlation output table contains all required information, but correct reading depends on understanding each component.
Pearson Correlation Coefficient (r)
The correlation coefficient shows relationship strength and direction.
Common interpretation thresholds:
- 0.10–0.29: weak correlation
- 0.30–0.49: moderate correlation
- 0.50 and above: strong correlation
These thresholds help interpret effect size, a topic frequently searched as effect size Pearson correlation.
Need Help Interpreting Pearson Correlation in SPSS?
Not sure whether your Pearson correlation results are correct or how to report them? Our SPSS experts analyze your data, interpret the output accurately, and deliver clear, publication-ready results. Avoid costly mistakes and reviewer revisions.
✔ Correct Pearson correlation calculation ✔ Clear interpretation of r, p-value, and effect size ✔ APA-style reporting included ✔ Fast turnaround with revisions
Significance Value (p Value)
The p value indicates whether the observed correlation likely occurred by chance.
- p < 0.05 indicates statistical significance
- p ≥ 0.05 indicates non-significance
Researchers often search for p value in Pearson correlation because misreading this value leads to invalid conclusions.
Sample Size (N)
SPSS reports the number of paired observations. Missing data can reduce N, which affects statistical power and degrees of freedom.
How to Interpret Pearson Correlation in SPSS
Correct interpretation combines:
- Direction of the relationship
- Strength of association
- Statistical significance
Example Interpretation
SPSS output reports:
- r = 0.57
- p = 0.002
- N = 95
Interpretation:
There is a moderate to strong positive correlation between the variables, r = 0.57, p < 0.01, indicating that higher values of one variable associate with higher values of the other.
Pearson Correlation Example
Consider a dataset examining daily screen time and sleep duration among adolescents.
SPSS output shows:
- Pearson r = –0.46
- Sig. (2-tailed) = 0.004
- N = 110
Interpretation:
The results show a moderate negative correlation between screen time and sleep duration, r = –0.46, p < 0.01, suggesting that increased screen time associates with reduced sleep duration.
This example matches common searches for pearson correlation SPSS example and demonstrates practical application.
Reporting Pearson Correlation
When reporting Pearson correlation in academic writing, include:
- Correlation coefficient
- Significance level
- Sample size
Example:
A Pearson correlation analysis revealed a significant positive relationship between motivation and performance, r(88) = 0.52, p < 0.01.
This format addresses frequent queries related to how to report Pearson correlation SPSS and degrees of freedom Pearson correlation SPSS.
Common Errors in Pearson Correlation Analysis
Researchers often make avoidable mistakes, including:
- Treating correlation as causation
- Ignoring non-linearity
- Using Pearson correlation with ordinal data
- Over-interpreting weak correlations
Competitive analysis of top-ranking content shows that articles addressing these errors outperform those that only explain calculation steps.
Conclusion
Pearson correlation provides a reliable method for examining linear relationships between quantitative variables when used correctly. Understanding how to calculate Pearson correlation SPSS, how to read SPSS Pearson correlation output, and how to interpret results strengthens both academic and applied research.
Need Help Running Pearson Correlation in SPSS?
We set up and run your Pearson correlation correctly in SPSS using your dataset. No setup errors, no wrong test selection, no wasted time.
Handled by SPSS specialists • Fast turnaround • Student-friendly pricing