Confirmatory factor analysis (CFA) is a multivariate statistical technique used to test whether observed variables adequately represent a predefined latent construct structure. Unlike data-driven methods, CFA is theory-driven. The researcher specifies the number of factors, the variables that load on each factor, and the relationships between factors before analysis begins.
In practical research contexts, CFA is applied to validate measurement models developed from prior theory, literature, or earlier exploratory factor analysis. It is commonly used in psychology, education, health sciences, marketing, and social sciences to confirm scale structure, assess construct validity, and evaluate measurement invariance across groups.
When researchers ask what is confirmatory factor analysis, the key distinction lies in intent. CFA tests hypotheses about factor structure rather than discovering it. This makes confirmatory factor analysis essential when working with established instruments or when refining survey questionnaires before structural equation modeling.
Exploratory and Confirmatory Factor Analysis: Key Differences
Confirmatory factor analysis and exploratory factor analysis serve different but complementary purposes within scale development and validation.
Exploratory factor analysis (EFA) is used when the underlying factor structure is unknown. The algorithm determines how many factors exist and which variables load on each factor. This approach is appropriate during early instrument development or when adapting a scale to a new context.
Confirmatory factor analysis, by contrast, is applied after a theoretical structure has already been established. The researcher specifies which items load on which latent variables and tests how well the model fits the observed data. CFA does not attempt to optimize the solution; instead, it evaluates model adequacy using fit indices.
In applied research, EFA is often conducted first, followed by CFA on a separate sample. This sequential approach strengthens construct validity and reduces the risk of capitalization on chance.
When to Use Confirmatory Factor Analysis
Knowing when to use confirmatory factor analysis is critical for defensible results. CFA is appropriate in the following situations:
- When validating an existing questionnaire or scale
- When testing a theoretical measurement model derived from literature
- When refining constructs before regression or SEM analysis
- When comparing factor structures across groups or time points
- When establishing convergent and discriminant validity
CFA should not be used as a replacement for exploratory analysis. If the factor structure is unknown or unstable, CFA results will likely show poor fit and misleading conclusions.
How to Run a Confirmatory Factor Analysis in SPSS
Standard SPSS does not include a built-in CFA procedure. Confirmatory factor analysis in SPSS is conducted using SPSS AMOS, which integrates seamlessly with SPSS datasets and supports graphical model specification.
Confirmatory Factor Analysis SPSS Steps
- Prepare the dataset in SPSS
Ensure variables are continuous or ordinal with sufficient categories. Screen for missing data, normality, and outliers. - Open SPSS AMOS
Load the SPSS data file directly into AMOS. - Specify the measurement model
Draw latent variables as ovals and observed variables as rectangles. Assign each observed variable to its theorized factor. - Set scale identification
Fix one factor loading per construct to 1.0 or constrain factor variance. - Define error terms
Assign a unique error term to each observed variable. - Run the analysis
Use maximum likelihood estimation unless data characteristics require an alternative estimator. - Examine model fit and parameter estimates
This workflow answers the common question how to run a confirmatory factor analysis in SPSS while maintaining methodological rigor.
How to Interpret Confirmatory Factor Analysis Results
Interpreting CFA output requires evaluation at both the model level and the parameter level.
Model Fit Indices
Key goodness-of-fit statistics include:
- Chi-square (χ²): Sensitive to sample size; should be interpreted cautiously
- CFI and TLI: Values above 0.90 indicate acceptable fit; above 0.95 indicate strong fit
- RMSEA: Values below 0.08 are acceptable; below 0.06 are preferred
- SRMR: Values below 0.08 indicate good fit
No single index determines adequacy. Interpretation must consider multiple indices collectively.
Factor Loadings
Standardized factor loadings should typically exceed 0.50 and be statistically significant. Low loadings suggest weak association between the observed variable and its latent construct.
Construct Validity
- Convergent validity is supported when factor loadings are high and average variance extracted exceeds 0.50
- Discriminant validity is supported when constructs are empirically distinct
This section directly addresses how to interpret confirmatory factor analysis results in applied research settings.
Multi Group Confirmatory Factor Analysis in SPSS
Multi group confirmatory factor analysis SPSS procedures are used to test measurement invariance across groups such as gender, country, cohort, or experimental condition.
The analysis follows a hierarchical testing sequence:
- Configural invariance
Tests whether the factor structure is the same across groups. - Metric invariance
Constrains factor loadings to equality across groups. - Scalar invariance
Constrains item intercepts across groups. - Strict invariance
Constrains residual variances.
Changes in fit indices, particularly ΔCFI and ΔRMSEA, are evaluated at each step. Establishing invariance supports meaningful group comparisons.
Common Mistakes in Confirmatory Factor Analysis
Several issues frequently undermine CFA results:
- Running CFA without theoretical justification
- Modifying models excessively based on modification indices
- Ignoring sample size requirements
- Treating ordinal Likert data as continuous without justification
- Failing to report full model fit statistics
Avoiding these errors improves replicability and reviewer acceptance.
Example of Confirmatory Factor Analysis
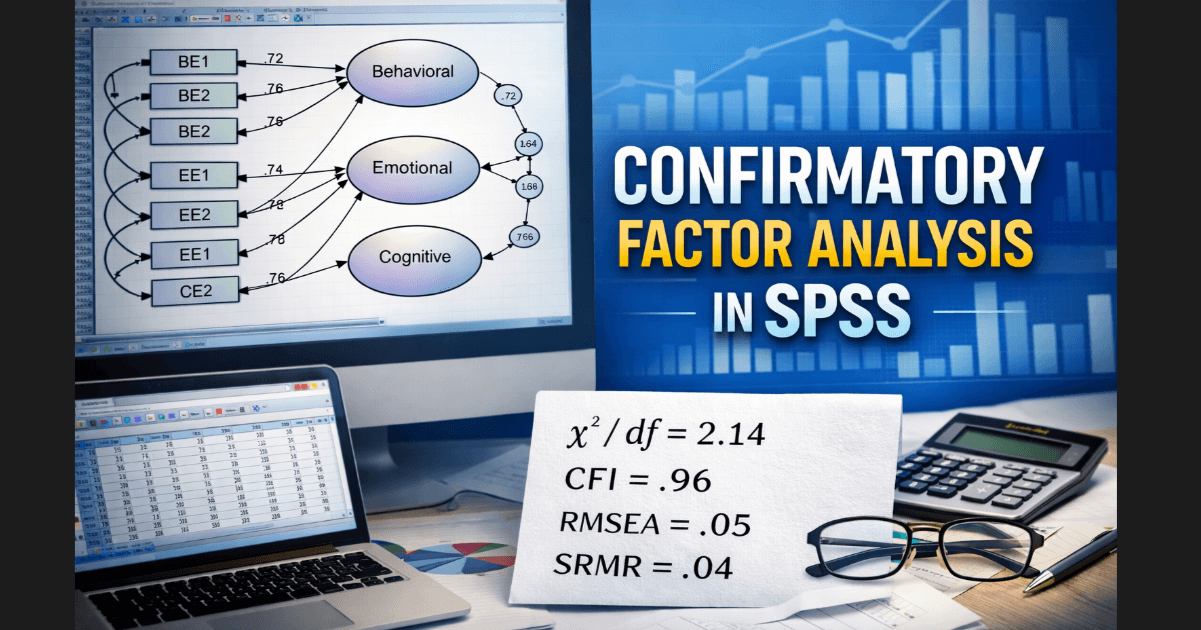
To illustrate confirmatory factor analysis in practice, a 12-item student engagement scale was evaluated using CFA in SPSS AMOS. The measurement model specified three latent constructs based on prior theory and scale development literature: Behavioral Engagement, Emotional Engagement, and Cognitive Engagement. Each latent factor was measured using four observed indicators.
Maximum likelihood estimation was applied. Model identification was achieved by fixing one factor loading per construct to 1.00. All error terms were specified as uncorrelated.
Model Fit Results
Overall model fit indices indicated a good fit between the hypothesized model and the observed data.
| Fit Index | Value | Recommended Threshold | Interpretation |
|---|---|---|---|
| χ²/df | 2.14 | < 3.00 | Acceptable |
| CFI | 0.96 | ≥ 0.90 | Good fit |
| TLI | 0.95 | ≥ 0.90 | Good fit |
| RMSEA | 0.05 | ≤ 0.08 | Good fit |
| SRMR | 0.04 | ≤ 0.08 | Good fit |
These indices collectively suggest that the three-factor measurement model adequately represents the data.
Standardized Factor Loadings
All observed variables loaded significantly on their respective latent constructs, with standardized loadings exceeding the commonly accepted cutoff of 0.50.
| Construct | Item | Standardized Loading |
|---|---|---|
| Behavioral Engagement | BE1 | 0.72 |
| BE2 | 0.68 | |
| BE3 | 0.75 | |
| BE4 | 0.70 | |
| Emotional Engagement | EE1 | 0.66 |
| EE2 | 0.71 | |
| EE3 | 0.74 | |
| EE4 | 0.69 | |
| Cognitive Engagement | CE1 | 0.78 |
| CE2 | 0.73 | |
| CE3 | 0.76 | |
| CE4 | 0.81 |
All factor loadings were statistically significant (p < .001), indicating strong relationships between the observed items and their underlying constructs.
APA-Style Reporting of CFA Results
The confirmatory factor analysis supported the hypothesized three-factor structure of the student engagement scale. The model demonstrated good fit to the data, χ²/df = 2.14, CFI = .96, TLI = .95, RMSEA = .05, SRMR = .04. All standardized factor loadings were statistically significant and exceeded .65, providing evidence of adequate convergent validity. These results indicate that the behavioral, emotional, and cognitive engagement constructs were reliably measured and empirically distinct.
Based on the CFA results, the measurement model was deemed suitable for use in subsequent analyses, including regression modeling and structural equation modeling.
Conclusion
Confirmatory factor analysis is a foundational technique for validating measurement models and ensuring construct validity in quantitative research. When conducted correctly using SPSS AMOS, CFA provides robust evidence that survey instruments measure what they are intended to measure.
Understanding confirmatory factor analysis SPSS steps, knowing when to use confirmatory factor analysis, and correctly interpreting results are essential for high-quality academic and applied research. For researchers seeking publication-ready analysis, careful model specification and transparent reporting are non-negotiable.