Repeated measures ANOVA in SPSS is a core statistical technique used when the same participants are measured multiple times under different conditions or across time. It is common in psychology, education, health sciences, nursing, and experimental research where within-subject designs are preferred. Unlike between-subjects ANOVA, repeated measures designs reduce error variance and improve statistical power because each participant serves as their own control.
This guide explains how to run repeated measures ANOVA in SPSS, how to read and interpret the output, how to handle one-way and two-way repeated measures designs, and how to report effect size correctly. The explanations are practical, step-by-step, and aligned with thesis and dissertation standards.
What Is Repeated Measures ANOVA?
Repeated measures ANOVA is used when the same sample is measured on the same dependent variable more than once. These measurements may occur at different time points or under different experimental conditions.
Typical examples include:
- Measuring anxiety levels before, during, and after an intervention
- Comparing test scores across multiple teaching methods applied to the same students
- Evaluating patient outcomes across several follow-up periods
In SPSS, repeated measures ANOVA is implemented using the General Linear Model (GLM) framework.
Assumptions of Repeated Measures ANOVA in SPSS
Before running the analysis, confirm that the assumptions are met:
- Continuous dependent variable
- Categorical within-subject factor(s) with at least two levels
- Normality of residuals at each time point
- No significant outliers
- Sphericity, meaning equal variances of the differences between conditions
SPSS automatically tests sphericity using Mauchly’s Test, and provides corrections if the assumption is violated.
How to Run Repeated Measures ANOVA in SPSS
Understanding how to run repeated measures ANOVA in SPSS correctly prevents model misspecification and reporting errors.
Step 1: Data Structure
Your dataset must be in wide format, where each repeated measurement is in a separate column.
Example:
- Score_Time1
- Score_Time2
- Score_Time3
Each row represents one participant.
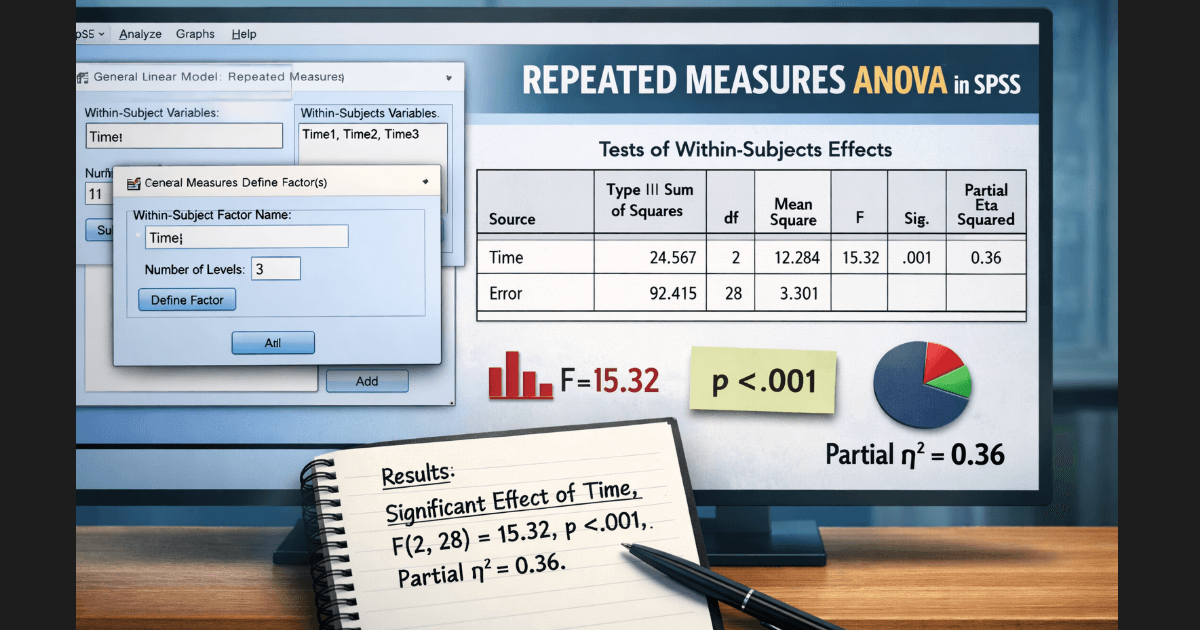
Step 2: Define the Within-Subject Factor
- Click Analyze
- Select General Linear Model
- Choose Repeated Measures
Enter:
- Within-subject factor name (for example, Time)
- Number of levels (for example, 3)
Click Add, then Define.
Step 3: Assign Variables
Move the repeated measurement variables into the within-subject slots in the correct order.
Step 4: Options and Plots
- Click Options
- Select Descriptive Statistics
- Select Estimates of Effect Size
- Add the within-subject factor to Display Means
Click OK to run the analysis.
One-Way Repeated Measures ANOVA in SPSS
A one-way repeated measures ANOVA in SPSS involves one within-subject factor with multiple levels.
Example:
- Stress measured at baseline, 4 weeks, and 8 weeks
The primary question answered is whether there is a statistically significant difference in the dependent variable across time or conditions.
In SPSS output, focus on:
- Mauchly’s Test of Sphericity
- Tests of Within-Subjects Effects
- Pairwise Comparisons if requested
Two-Way Repeated Measures ANOVA in SPSS
A two-way repeated measures ANOVA in SPSS includes:
- Two within-subject factors, or
- One within-subject factor and one between-subjects factor
Example:
- Time (pre, post) as within-subject
- Gender as between-subjects
This design allows you to test:
- Main effect of Time
- Main effect of Group
- Interaction between Time and Group
SPSS reports these effects separately, making interpretation straightforward when the model is specified correctly.
How to Read Repeated Measures ANOVA SPSS Output
Mauchly’s Test of Sphericity
- If p > 0.05, sphericity is met
- If p ≤ 0.05, use corrected results (Greenhouse-Geisser or Huynh-Feldt)
Tests of Within-Subjects Effects
This table shows whether the repeated measures factor has a statistically significant effect.
Key columns:
- F value
- Degrees of freedom
- Sig. (p-value)
- Partial Eta Squared (effect size)
Pairwise Comparisons
If the overall effect is significant, pairwise comparisons identify which specific time points differ.
How to Interpret Repeated Measures ANOVA Results in SPSS
To interpret repeated measures ANOVA results in SPSS:
- Report whether sphericity was met or corrected
- Report the F statistic, degrees of freedom, and p-value
- Interpret the direction of change using means
- Report effect size
Example interpretation:
A repeated measures ANOVA showed a significant effect of time on anxiety scores, F(2, 58) = 12.41, p < .001, partial η² = .30, indicating a large effect.
This structure is appropriate for theses, dissertations, and journal manuscripts.
Effect Size in Repeated Measures ANOVA SPSS
Effect size quantifies the practical importance of findings, not just statistical significance.
SPSS reports Partial Eta Squared (η²p) by default.
Common benchmarks:
- 0.01 = small
- 0.06 = medium
- 0.14 = large
Always report effect size alongside p-values, especially in graduate-level research and peer-reviewed work.
Post Hoc Tests and Pairwise Comparisons
Repeated measures designs do not use traditional post hoc tests like Tukey. Instead, SPSS provides pairwise comparisons with Bonferroni adjustment.
These comparisons explain:
- Where differences occurred
- Between which specific conditions or time points
Reporting ANOVA Results in APA Style
A standard APA-style report includes:
- Design type
- Assumption handling
- Test statistics
- Effect size
- Direction of effects
Example:
A one-way repeated measures ANOVA indicated a significant effect of treatment phase on performance scores, F(2, 46) = 9.87, p = .001, partial η² = .30.
Common Errors When Using Repeated Measures ANOVA in SPSS
Researchers frequently make avoidable mistakes:
- Incorrect data structure
- Ignoring sphericity violations
- Reporting uncorrected degrees of freedom
- Omitting effect size
- Misinterpreting interaction effects
Each of these errors can weaken a dissertation or trigger reviewer criticism.
When You Need Expert SPSS Support
ANOVA becomes complex when designs include multiple factors, missing data, or violations of assumptions. Many students struggle with interpretation, corrections, and APA reporting.
If you are working on a thesis or dissertation and need accurate modeling, interpretation, and reporting, professional SPSS dissertation help ensures your analysis meets academic and methodological standards.
Conclusion
Repeated measures ANOVA in SPSS is a powerful method for analyzing within-subject data, but it requires careful setup, assumption testing, and interpretation. Understanding how to run repeated measures ANOVA in SPSS, how to read the output, and how to interpret results correctly ensures defensible conclusions and publication-ready reporting.
When applied correctly, one-way and two-way repeated measures ANOVA provide clear insights into change over time and condition effects. When applied incorrectly, they introduce avoidable errors. Precision and expertise make the difference.